
Figure 4. Multi-platform-based subtype discovery in papillary renal cell carcinoma.
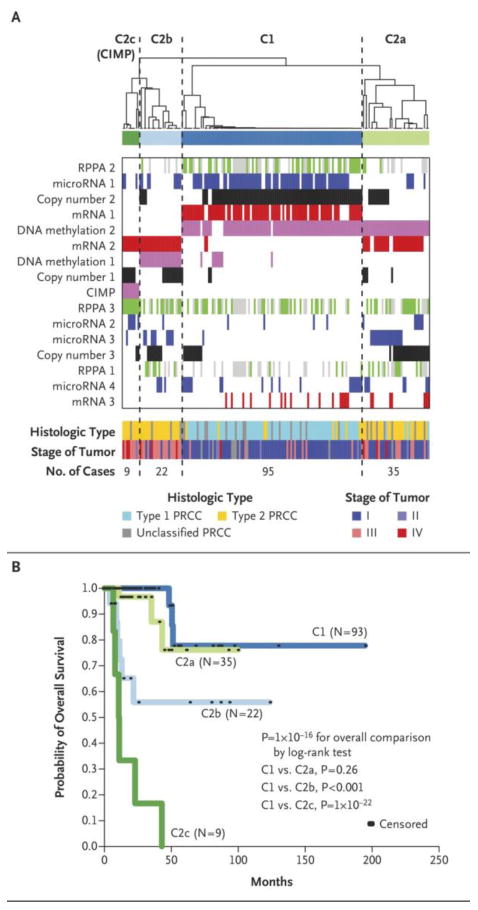
(a) Integration of subtype classifications from five “omic” data platforms using cluster of cluster analysis identified four major papillary renal cell carcinoma groups: C1 (Type 1-enriched), C2a and C2b (Type 2-enriched), and C2c (representing the CIMP papillary renal cell carcinomas). The blue and white heat map displays sample consensus, below which a second heat map displays the subtypes defined independently by DNA methylation (Pink), Chromosomal copy number (CN)(Black), miRNA expression (Red), mRNA expression (Blue), and protein (RPPA) expression (Green, Gray represents samples missing RPPA expression data). Clinical features associated with the multi-platform-based subtypes are shown near the bottom. Histological types are shown with Type 1 in light blue, Type 2 in yellow and unclassified papillary renal cell carcinoma in gray. Stage I and II tumors are shown in dark blue or light blue respectively, and Stage III and IV tumors are shown in light red or dark red respectively. (b) Differences in patient overall survival between COCA defined groups (overall, p<1E-16, log-rank). In comparison to the Type 1-enriched C1group, the overall survival of the Type 2-enriched C2a group was similar, while the C2b (* p=0.003) and CIMP (** p=1E-22) groups had worse overall survival.