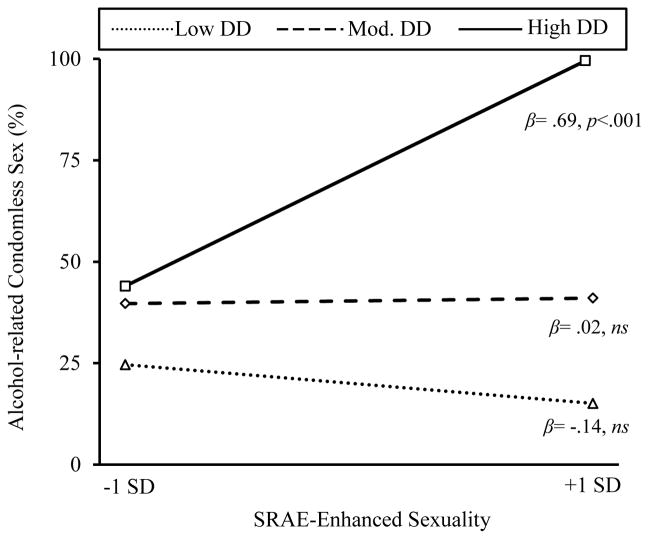
Figure 2.
Line graphs depicting the significant interaction between the sex-related alcohol expectancy – enhanced sexuality domain score and delay discounting. The dependent variable reflects the percentage of non-steady partner sexual activity that is condomless and involved alcohol. For the purpose of graphing, a tertile split was applied to the continuous overall k value, resulting in three groups: Low Delay Discounting (DD; n = 40), Moderate DD (n = 46), and High DD (n = 40).

