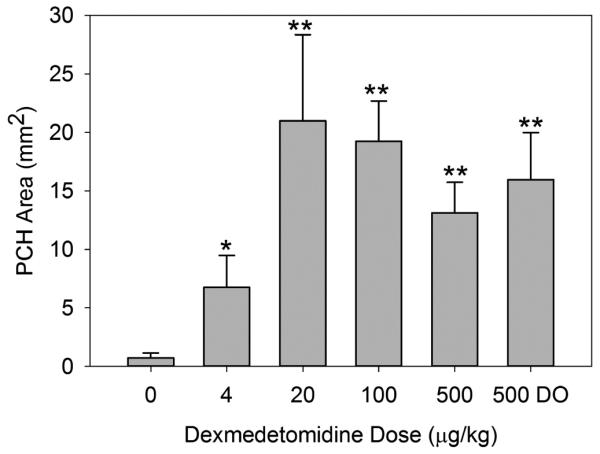
Figure 5.

A graph of the PCH area results for the different dexmedetomidine doses (Table 3). The PCH is not significantly greater than shams for the ketamine with zero dexmedetomidine, but is statistically significant for the lowest dose of 4 μg/kg (P<0.05, *), and the other doses (P<0.01, **). The result for dexmedetomidine only (DO) is not significantly different from the same dose with added ketamine.
