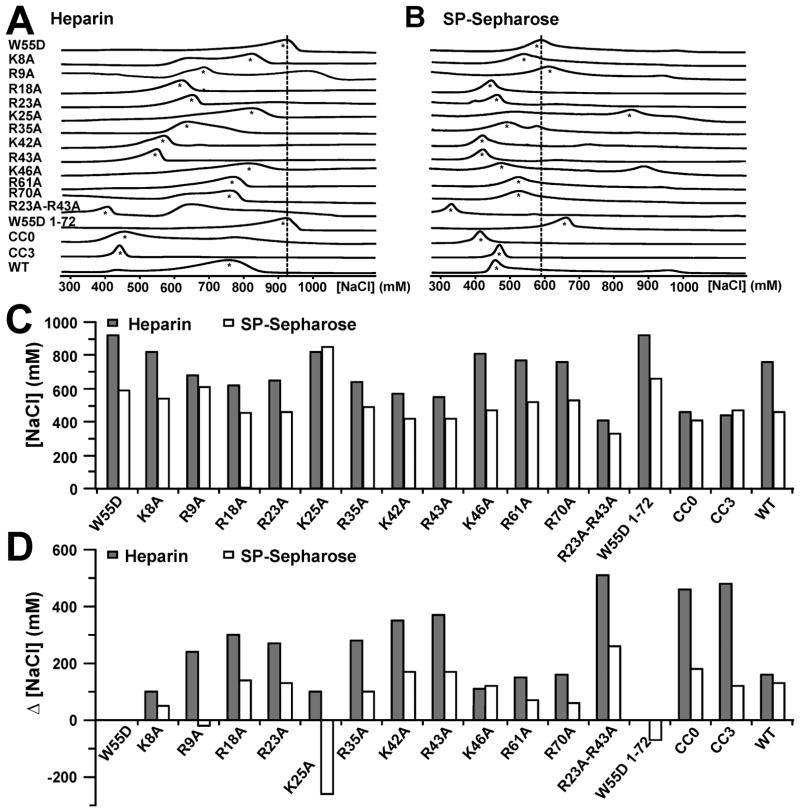
Figure 3.
Determination of heparin binding residues in XCL1dim. W55D and several variants were eluted from a heparin Sepharose and an SP-Sepharose column as a function of increasing NaCl concentration. The raw chromatographs are shown for heparin in panel A and for SP-Sepharose in panel B. The dashed lines are aligned with the maximal peak height for W55D elution and were added as a point of reference. Asterisks are indicative of peaks that were selected for analysis. Graphical representations of values from Table 1. (C) Concentrations of NaCl ([NaCl]) needed to elute proteins from heparin (gray bars) and SP-Sepharose (white bars). (D) Changes in NaCl concentration (Δ[NaCl]) needed to elute proteins from heparin and Sepharose columns compared to W55D.

