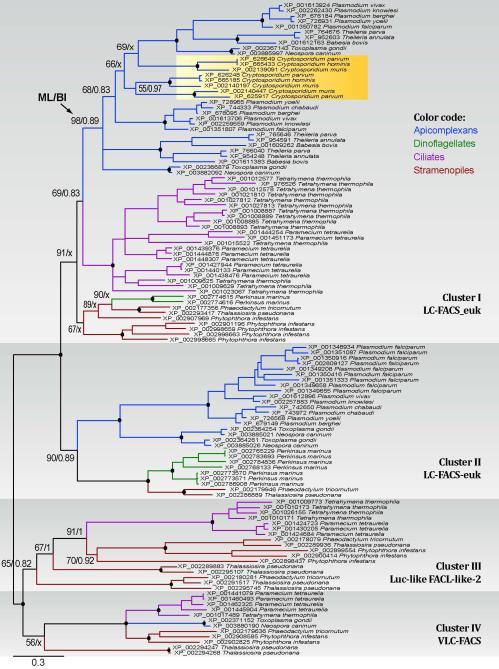
Figure 2.
Phylogenetic tree inferred from ACS proteins among chromalveolates using Bayesian inference (BI) and maximum likelihood (ML) methods. Numbers at the nodes indicate posterior probability and bootstrapping proportion supporting values obtained in BI and ML analyses. Numbers of sequences contained in specified clusters are indicated in parentheses after the species names.

