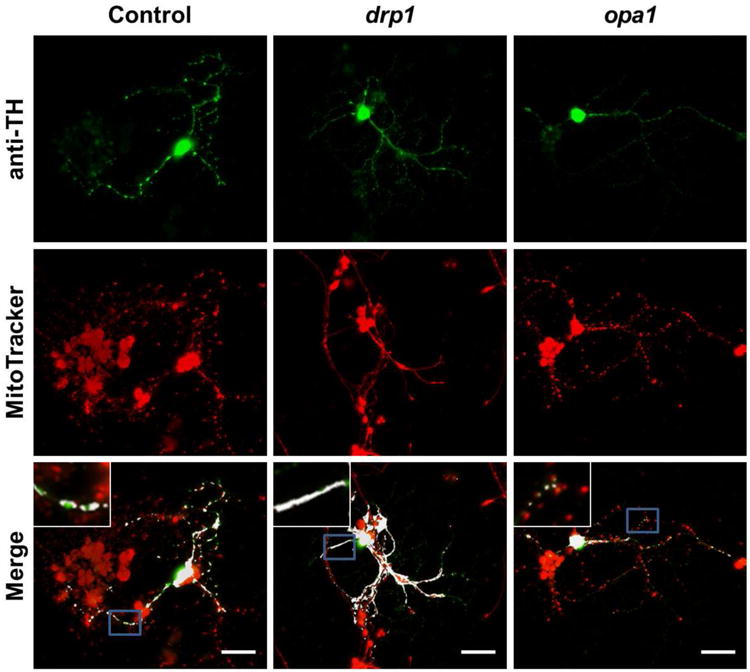
Figure 2. Mitochondrial morphology in fission and fusion mutants.

Quantification of mitochondrial morphology in control and mutant neuronal cultures. Top row: dopaminergic (DA) cells for control, drp1 mutants, and opa1 mutants. Signal is from antibody to tyrosine hydroxylase (TH), selectively marking soma and neurites of DA neuron. Middle row: images of MitoTracker staining for control, drp1 and opa1. Mitochondria from all cell types are stained. Bottom row: overlapped image of anti-TH and MitoTracker signals. Colocalized signals are shown in white, i.e. are mitochondria from DA neurons. Single-embryo cell cultures on individual glass coverslips were prepared from drp1/CyO-GFP and opa1/CyO-GFP fly lines. At 3 DIV, coverslips were selected by the presence/intensity of the live-GFP signal. Coverslips without a live-GFP signal were homozygous for drp1 or opa1. Coverslips with the brightest live-GFP signals were used as controls. At 7 DIV, coverslips were stained with anti-TH and MitoTracker and images were taken for analysis (scale bar = 20 μm, insets are of areas outlined in blue).
