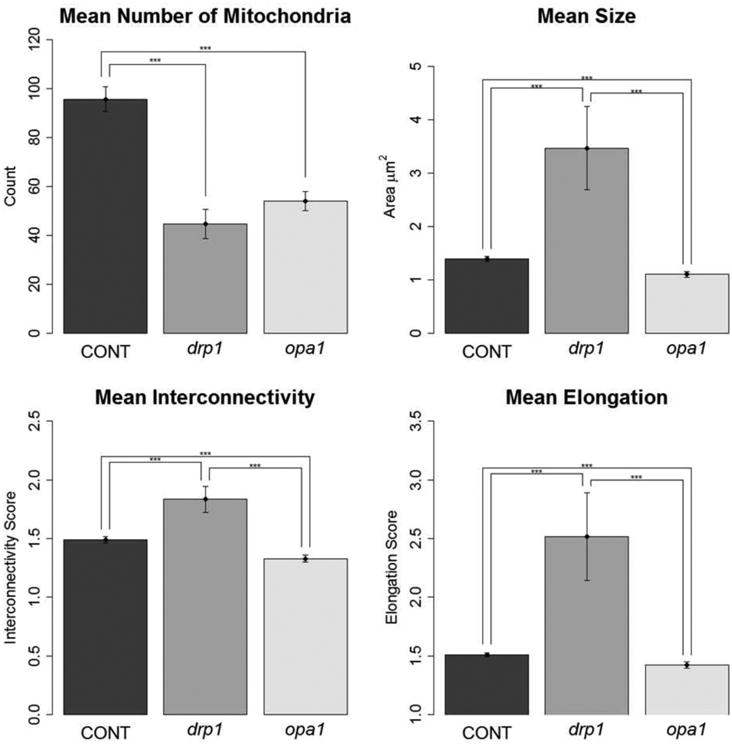
Figure 3. Cells with decreased mitochondrial fission or fusion have changes in all measured parameters.

Quantification of mitochondrial morphology in control and mutant neuronal cultures. Graphs showing morphological characteristics of mitochondria: number, size, interconnectivity, and elongation. drp1 mutants had larger, more interconnected, and elongated mitochondria compared to control and opa1, while opa1 had smaller, less interconnected, and less elongated mitochondria compared to drp1 and control. Both drp1 and opa1 had fewer mitochondria than control – likely because in drp1 cells, the mitochondria are all connected and thus not counted as separate, and in opa1 cells because the fragmented mitochondria are translocated to the soma where they are not included in analysis. At 7 DIV, images were taken for analysis (Tukey's HSD test; number of experiments: Control, n = 7; drp1, n = 3; opa1 n = 3; *** p < 0.001).
