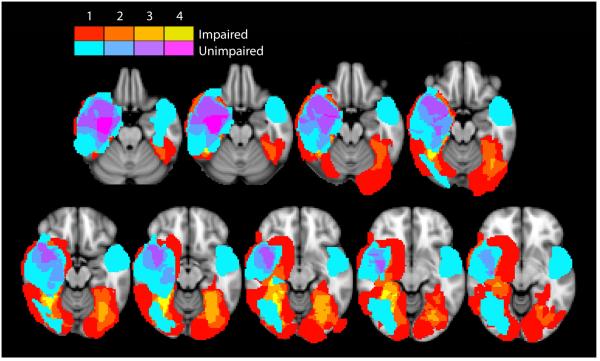
Figure 4.
Overlap lesion analysis for cognitive map formation. The overlap axial image of lesions from those with intact performance is shown as a color spectrum from blue to fuchsia, with blue indicating regions involved by the lesion in only one subject, and fuchsia indicating regions where the lesions of four subjects overlapped. This image is placed over the overlap image of lesions from those with impaired performance, shown as a color spectrum from red to fellow, with red indicating regions involved by the lesion in only one subject, and yellow indicating regions where the lesions of four subjects overlapped. Hence visible yellow regions represent regions with lesions in at least 4 subjects with impaired cognitive map formation and not involved by the lesions of any subjects with intact cognitive map formation.

