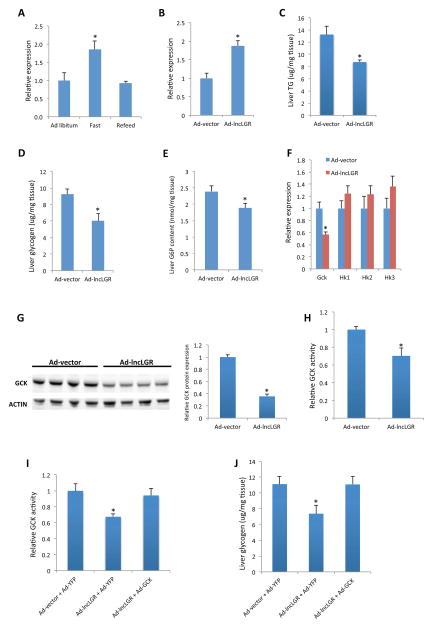
Figure 1. Overexpression of lncLGR suppresses GCK expression and glucose metabolism in mouse liver.
(A) Expression levels of lncLGR in the livers of mice (n=4) fed ad libitum (Ad Libitum), subject to a 24-hour fast (Fast), or subject to a 24-hour fast followed by a 4-hour refeeding (Refeed).
(B) Expression levels of lncLGR in the livers of control (Ad-vector) and lncLGR overexpression (Ad-lncLGR) mice (n=6) after a 4h food withdrawal.
(C) Liver TG content, (D) liver glycogen content, (E) liver G6P content and (F) liver gene expression levels in control and lncLGR overexpression mice (n=5–7) after a 4h food withdrawal.
(G) GCK protein levels in the livers of control and lncLGR overexpression mice (n=4). Intensities of bands were quantified and normalized to actin levels as shown on the right.
(H) Relative GCK activity in the livers of control and lncLGR overexpression mice (n=6).
(I) Relative GCK activity and (J) glycogen levels in the livers of mice receiving control, lncLGR overexpression, or both lncLGR and GCK overexpression adenoviruses (Ad-GCK) after a 4h food withdrawal (n=6).
Error bars represent SEM, *p<0.05.

