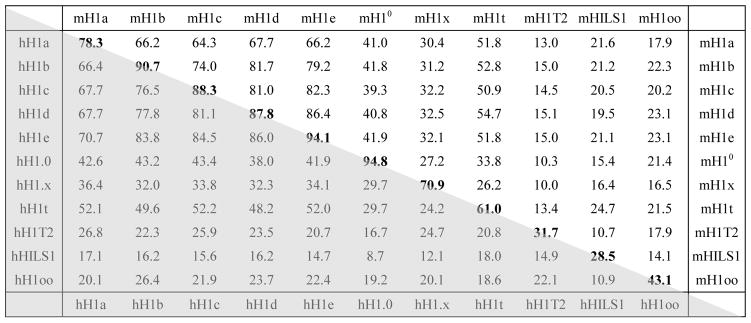
Table 2.
Sequence similarity among H1 variants in mouse and humana
The numbers indicate the percentage of identity between two aligned H1 variants. Sequence comparisons between mouse H1 variants are shown in the upper half of the table (non-shaded) and those between human H1 variants are shown in the lower half (shaded). The bold numbers at the diagonal represent the sequence similarity between mouse H1 variants and their human counterparts.

