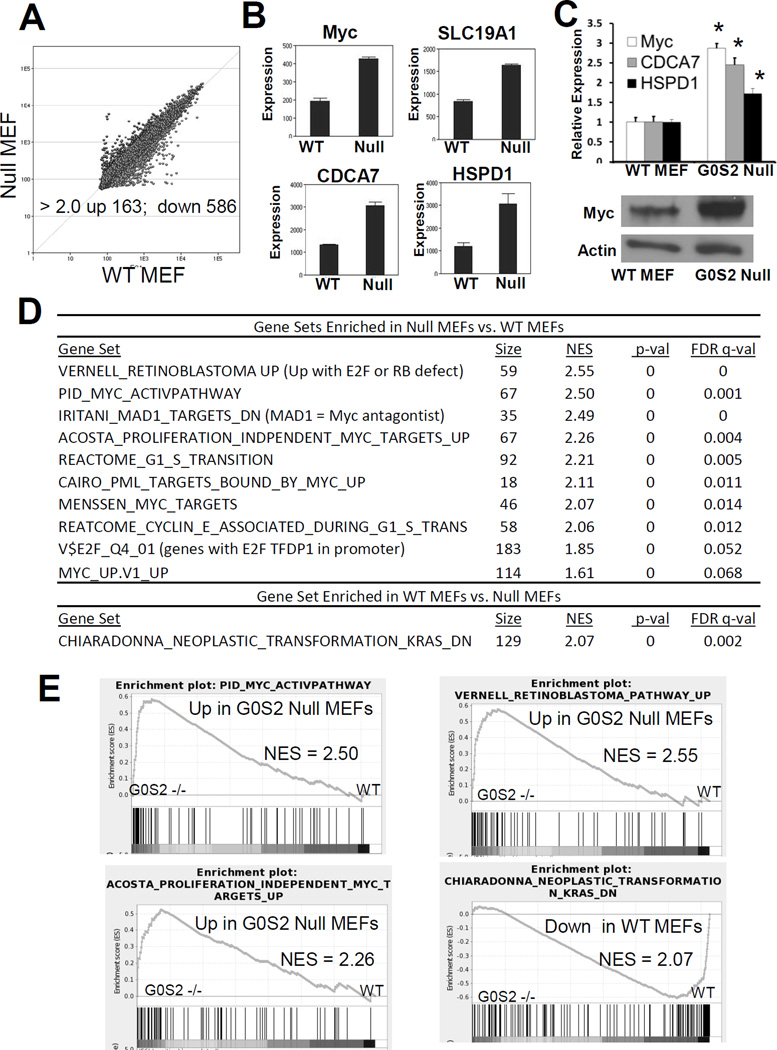
Figure 3. G0s2 null cells have upregulated signatures associated with transformation and MYC.
A, Scatter plot of microarray analysis (Illumina MouseRef-8 v2) from differential gene expression profiles of G0s2 null MEFs vs. WT MEFs. Each point represents the average of 3 biological replicates. Points above the diagonal line represent genes upregulated and points below the diagonal line repressed in G0s2 null MEFs. The number of altered genes above a 2-fold threshold was changed with P < 0.01. B, Microarray results for MYC and MYC targets, SLC19A1, CDCA7, and HSPD1. C, Top, Real-time PCR assay confirmation of induction of MYC and MYC targets CDCA7 and HSPD1 in G0s2 null MEFs as compared to wild-type MEFs. Bottom, MYC protein is expressed at a high level in G0s2 null cells as compared to wild-type MEFs. Bars are average of biological triplicates. Error bars are standard deviation. * = P <0.05. D–E, Gene Set Enrichment Analyses (GSEA) of G0s2 null MEFs as compared to control MEFs indicating that G0s2 null MEFs are enriched for gene signatures associated with MYC activation, proliferation and transformation.

