Figure 5.
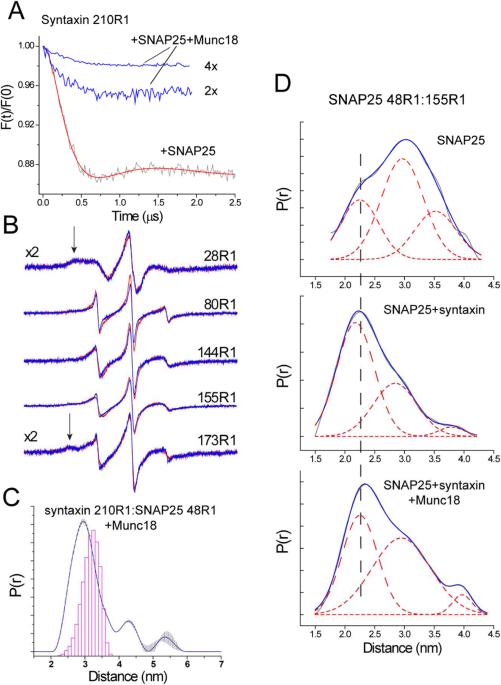
Syntaxin remains associated to SNAP25 following the addition of Munc18-1. (A) Background corrected DEER data obtained for 20 μM syntaxin 210R1 in the presence of 120 μM SNAP25 (red trace) indicates the formation of the 2:1 Syntaxin:SNAP25 complex; addition of Munc18-1 in 2 and 4 fold excess over syntaxin dissociates the 2:1 complex. (B) EPR spectra from sites on SNAP25 (40 μM) when bound to syntaxin (60 μM) in the absence (red) and presence (blue) of Munc18-1 (120 μM). The arrows indicate components due to tertiary contact of the label, which results in incompletely averaged hyperfine interactions. (C) Distance distribution obtained between syntaxin 210R1 and SNAP25 48R1 (both at 40 μM in the presence of 80 μM Munc18-1. (D) Distance distributions obtained for SNAP25 48R1/155R1 in solution (top), bound to syntaxin (1-262) (middle), and bound to syntaxin and Munc18-1 (bottom). Shown in each figure is the distribution giving the best fit to the DEER data (grey trace), and a fit to this distribution using 3 Gaussians (solid red trace and three dashed traces). Samples contain 50 μM SNAP25, 50 μM syntaxin (1-262) and 90 μM Munc18-1.

