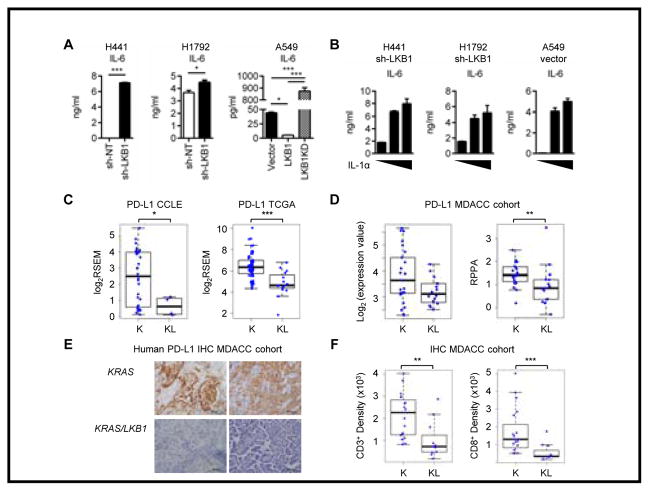
Figure 3. LKB1 inactivation in human KRAS mutated cell lines showed similar phenotype with mouse Kras/Lkb1 tumor.
A. Analysis of IL-6 in the culture supernatants after 48hr incubation of KRAS mutated LKB1 wild type H441 or H1792 cells stably transfected with sh-NT or sh-LKB1 and KRAS, LKB1 mutant A549 cells reconstituted with empty vector (Vector), wild type LKB1 or Kinase dead LKB1 (LKB1KD). *p<0.05, ***p<0.001. Data indicate three replicate wells and are representative of three independent experiments. B. IL-6 levels in culture supernatants measured 24hr after IL-1α stimulation (0, 5 and 20ng/ml) of three LKB1-deficient cell lines. Data indicate three replicate wells and are representative of three independent experiments. C. PDL1 expression in KRAS (K) or KRAS and LKB1 mutated (KL) cell lines from CCLE database (*p=0.04) and PDL1 expression in K or KL lung adenocarcinoma samples from TCGA database (***p=0.00004). D. PD-L1 mRNA levels determined by microarray (p=0.1) and protein levels (**p=0.009) determined by RPPA from the MDACC dataset. E. Representative immunohistochemistry for PD-L1 on the KRAS mutated LKB1 wt or mutant patient tumors from the MDACC cohort. F. CD3 (**p=0.002) and CD8 (***p=0.0003) positive cell densities by immunohistochemistry on the MDACC patient cohorts.

