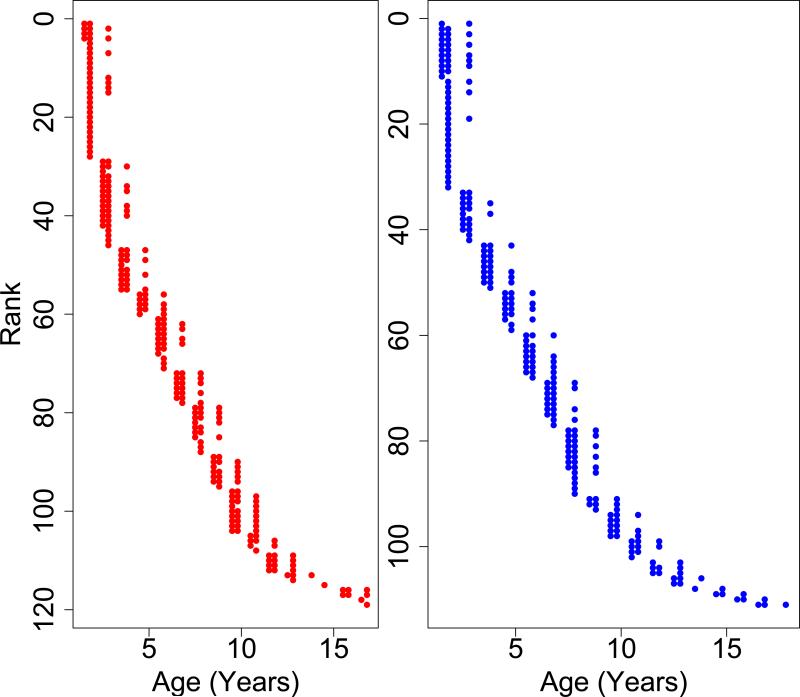
Figure 1. Plot of all ages of each individual maramoset.
Marmosets are ranked by age. Each point represents a blood sample that was taken from an individual marmoset. The y-axis values represents a single marmoset while the x-axis values represents the age at which it was sampled. Animals were sampled either 1, 2, or 3 times. Females are in red on the left; males on the right in blue.

