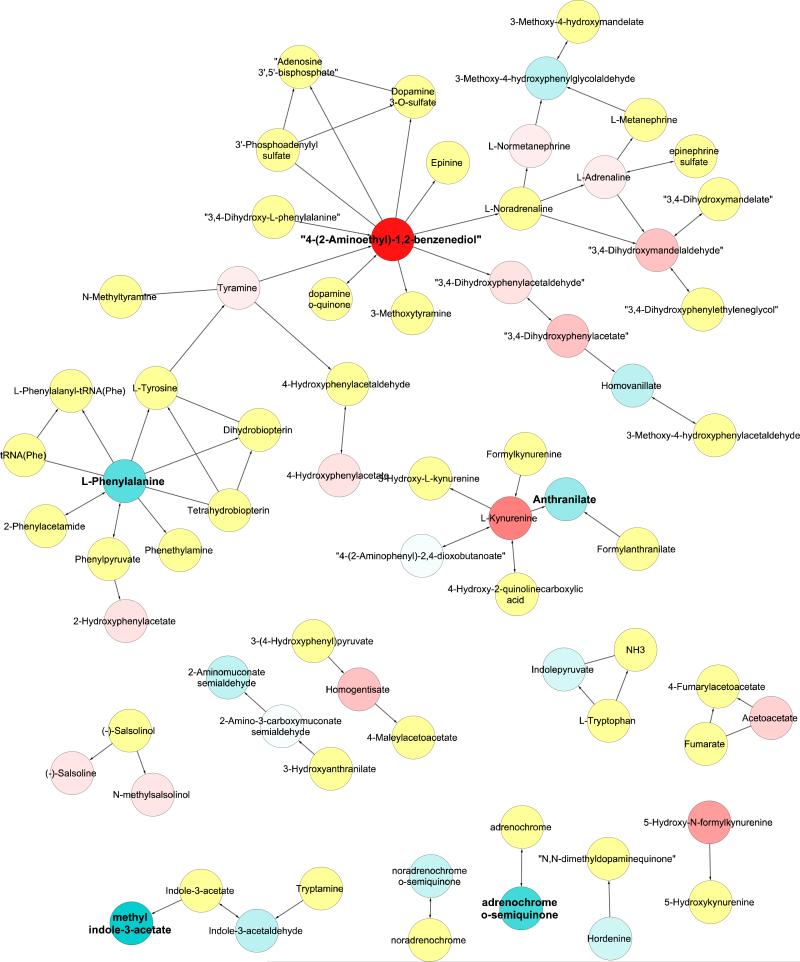
Figure 4. Metabolites in Tryptophan and Tyrosine metabolism pathway.
Each circle represents a metabolite in the metabolic pathway, and lines with arrows are known metabolic interactions. Blue circles decrease with age while red circles increase with age. The degree of saturation indicates the strengths of the response. Metabolites in the metabolic pathway but not found in our dataset are colored yellow. Bold names indicate metabolites with significant changes with age (FDR<0.1). Results shown are for males only.

