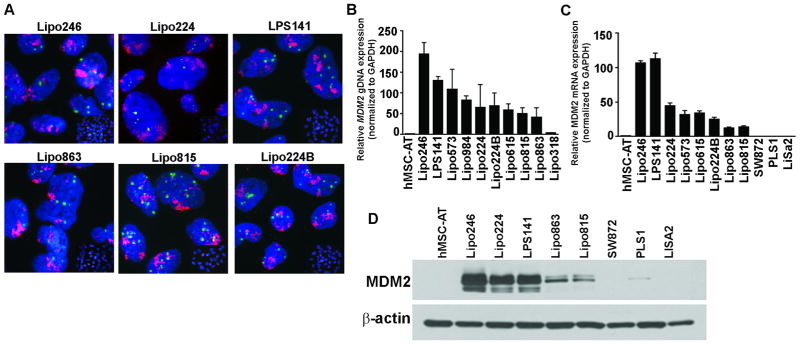
Figure 1. MDM2 amplification and expression in DDLPS cell panel.
(A) Representative images of fluorescence in situ hybridization of the 12q13~15 amplicon in a cell line panel (MDM2: red signal and CEP12: green signal); DDLPS: Lipo246, Lipo224, Lipo863, Lipo815, Lipo224B, LPS141; Pleomorphic LPS: SW872, PLS1, LiSa2. (B) q-PCR was performed for MDM2 genomic amplification on a large DDLPS cell line panel, along with hMSC-AT as a normal control (C) q-PCR analyzed MDM2 mRNA expression levels in DDLPS cell lines, hMSC-AT, and in two pleomorphic LPS cell lines, PLS1 and LiSa2. (D) Western blot analysis of MDM2 protein expression in DDLPS cell lines versus control cell lines.

