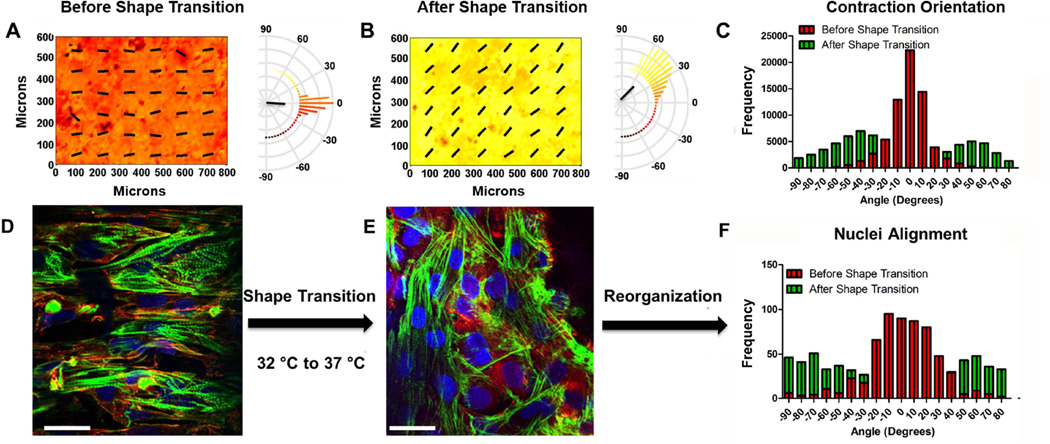
Figure 6. Alignment and contraction analysis of cardiac cell monolayer reorganization caused by an orthogonal shift in the orientation of PCL-based shape memory nanogrooves.
The direction of contraction at each location in the heat map before (A) and after (B) shape transition is indicated by color [coded to the polar histograms] and the overlaid vector field. Semicircular histograms of contraction angles indicate the overall directionality of contracting cardiac cells, of one field of view, on surfaces before and after shape transition. The black lines in the center of the histogram indicate the mean resultant vector length. The shift in contraction direction is better visualized in (C). The distribution of the contraction orientation after shape transition exhibits a bimodal behavior and does not behave like a Gaussian distribution. (Kurtosis = 2.184, −1.220 before and after, respectively. *p ≤ 0.001, n = 3, D’Agostino & Pearson omnibus normality test). Representative images of NRVM alignment on SMPs before (D) and after (E) shape transition (nuclei staining = blue, f-actin staining = green, vinculin staining= red; scale bar = 20 µm). Histograms of NRVM nuclei (F) before and after shape transition.

