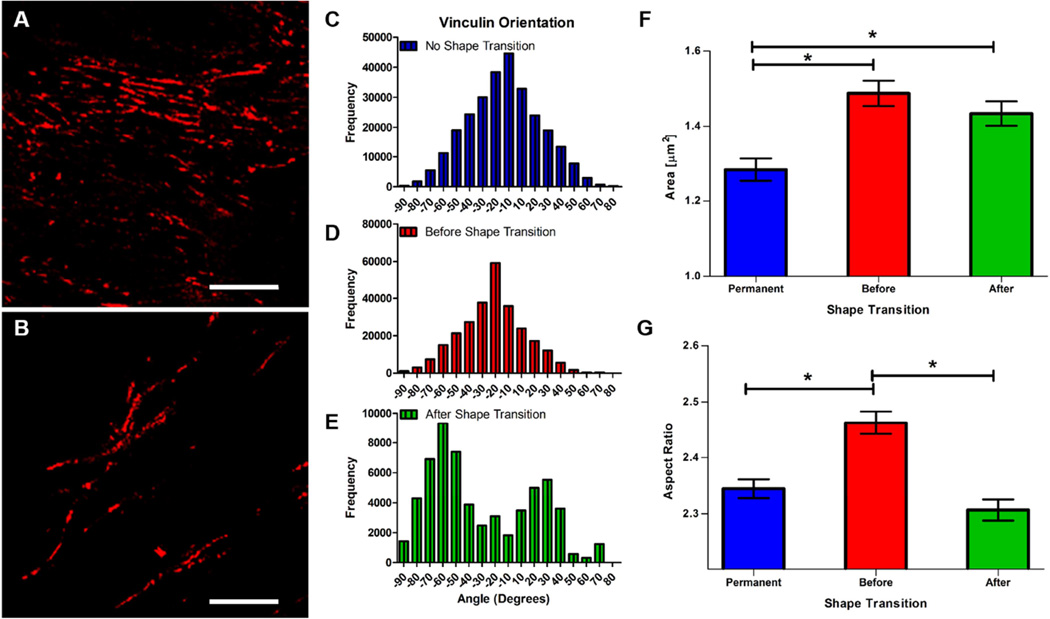
Figure 7. Effect of shape transition on cardiomyocyte vinculin orientation and shape.
(A) Representative image of NRVMs on SMP substrates before (A) and after (B) shape transition stained for vinculin (red) (scale bar = 10µm). (C, D, and E) Vinculin orientation distribution on permanent and SMP substrates. (F) Area of vinculin staining on permanent (mean ± standard error mean = 1.28±0.030) and SMP substrates before (1.49 ± 0.034) and after (mean = 1.434 ± 0.032) shape transition (n=1000 for all conditions). (G) Aspect ratio of vinculin staining on permanent (2.35 ±0.017) and SMP substrates before (2.46 ± 0.020) and after (2.307 ± .019) shape transition (no shape transition, n = 2028; before shape transition, n=1997; after shape transition, n=1447; * = p-value<0.001; * = p-value<0.0001).

