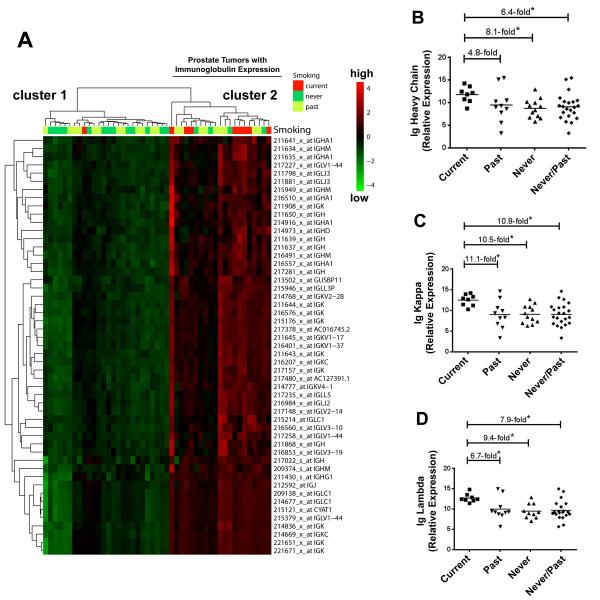
Figure 1. Immunoglobulin expression in prostate tumors from current, past, and never smokers.
(A) Hierarchical cluster analysis separates 47 prostate tumors (9 current, 21 past, and 17 never smokers) into 2 clusters based on immunoglobulin expression. Heatmap shows up-regulated immunoglobulin expression in cluster 2 (red color intensity). Current smokers are over-represented in this cluster (8/21 vs. 1/26 in cluster 1, P < 0.01) while the “low immunoglobulin” cluster 1 was enriched for tumors from never smokers (13/26 vs. 4/21 in cluster 2, P = 0.03). Patients’ smoking status is shown for each tumor above the heatmap. Shown are array-based expression data with corresponding probeset IDs. (B-D) Increased expression of immunoglobulin (Ig) heavy constant mu, kappa constant, and lambda locus in tumors from current smokers by qRT-PCR analysis. *Different at P < 0.05 between current smokers (n = 8) and past smokers (n = 10) or never (n = 12). qRT-PCR was performed on a subset of tumors from the microarray analysis.

