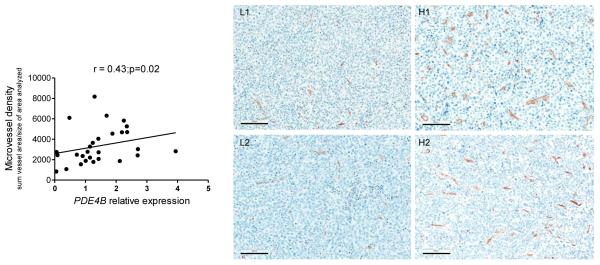
Figure 6. Correlation between PDE4B expression and angiogenesis in primary human DLBCL.
Linear regression analysis between PDE4B expression quantified by real-time RT-PCR and microvessel density, determined by CD34 staining, in 28 primary human DLBCLs (Spearman’s correlation coefficient r=0.43, p=0.02). Representative CD34 staining of DLBCLs with low or high MVD (left and right, respectively) is also shown. The size bar indicates 100 μm.

