
Figure 1.
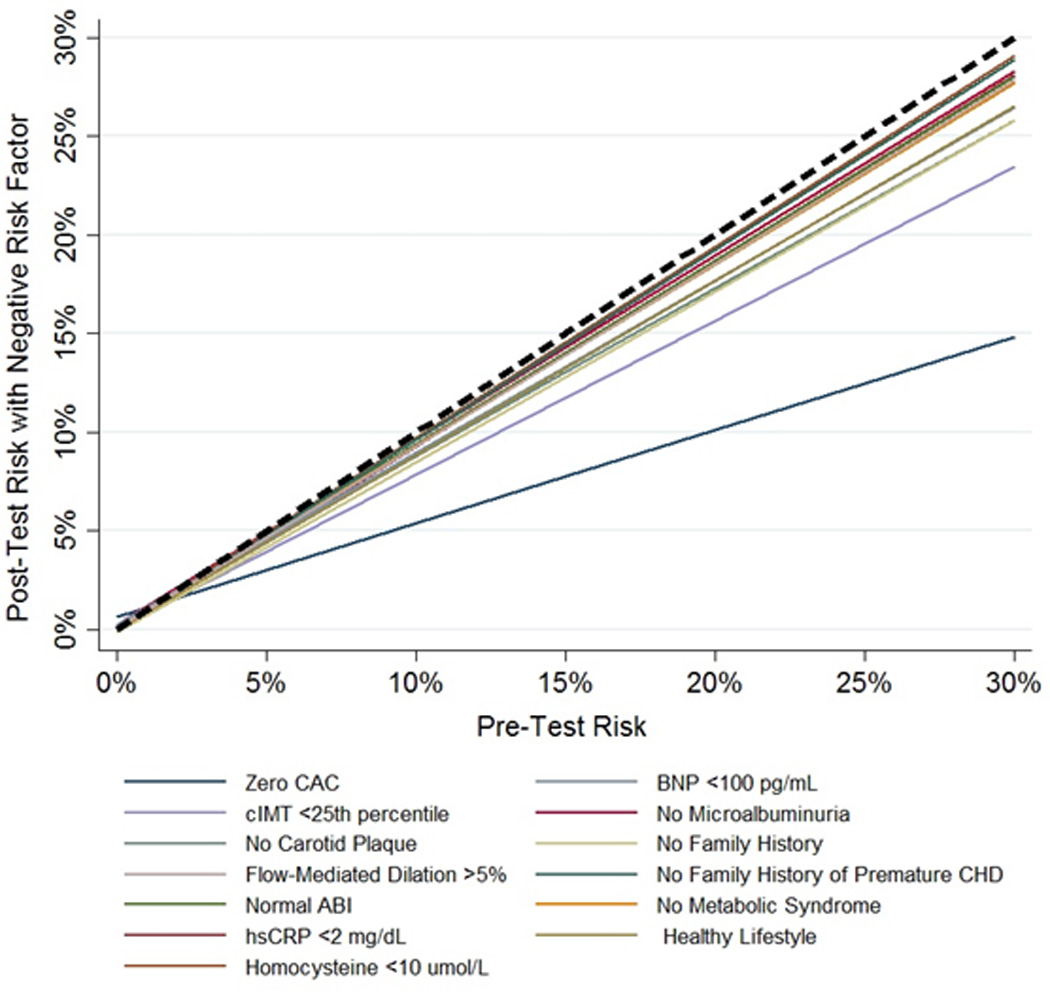
Relationship between pre-test and post-test CVD risk after the knowledge of the negative result of each risk marker. The regression lines display the relationship between the pre-test predicted 10-year ASCVD risk (x axis), and the post-test risk (y axis) after the knowledge of the negative result of each risk marker. A broken back line is displayed as reference (risk shift with no additional testing). Results were obtained by plotting the pre-test and post-test risk based on the DLR of each MESA participant, and then applying a linear fit. CAC indicates coronary artery calcium; CIMT, carotid intima-media thickness; FMD, flow-mediated dilation; ABI, ankle-brachial index; HsCRP, high sensitivity C-reactive protein; BNP, brain natriuretic peptide; and CHD, coronary heart disease.