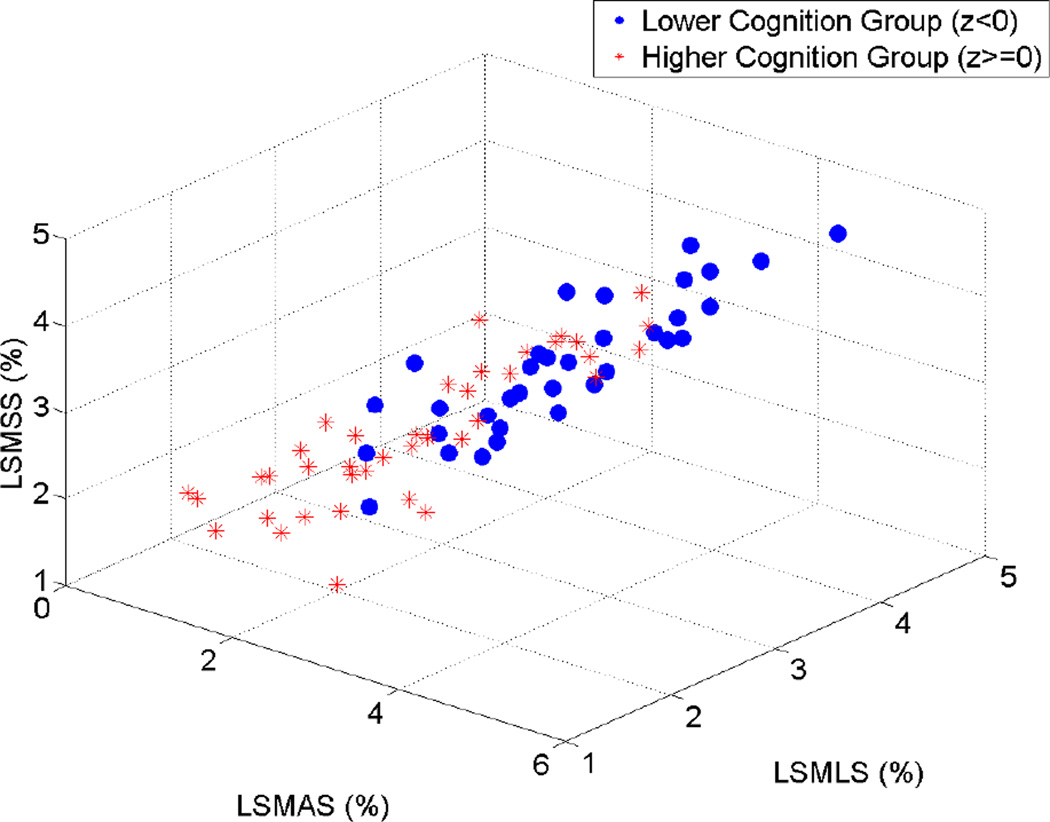
Figure 4.
Three-dimensional scatter plot of maximum axial, lateral and shear strain indices plotted against each other. ○ = Lower cognition group (z<0), * = higher cognition group (z≥0). LSMAS = Log-scaled maximum axial strain, LSMLS = log-scaled maximum lateral strain, LSMSS = log-scaled maximum shear strain.

