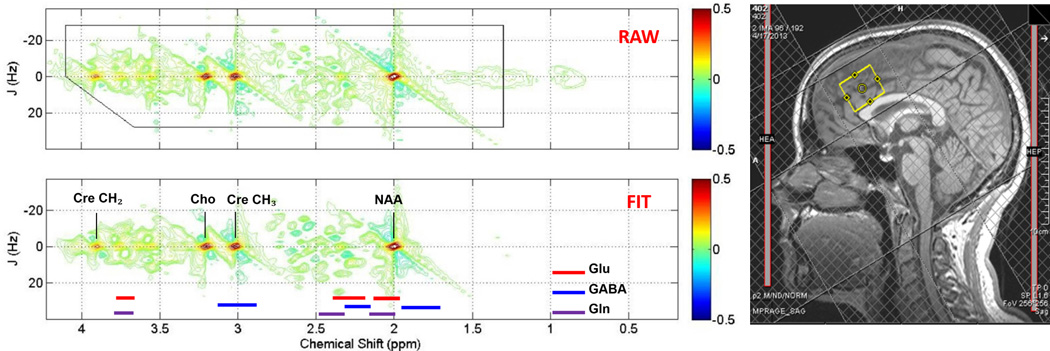
Figure 1.

Sample ACC voxel location (right) and raw (top) and fitted (bottom) two-dimensional j-resolved 1H-MRS spectra analyzed using Prior Knowledge Fitting (ProFit). Colored horizontal bars represent approximate primary spectral locations of Glu, GABA, and Gln. Gln=glutamine, Glu=glutamate, GABA=gamma-aminobutyric acid, NAA=n-acetyl aspartate, Cre=creatine, Cho=choline.
