Figure 2.

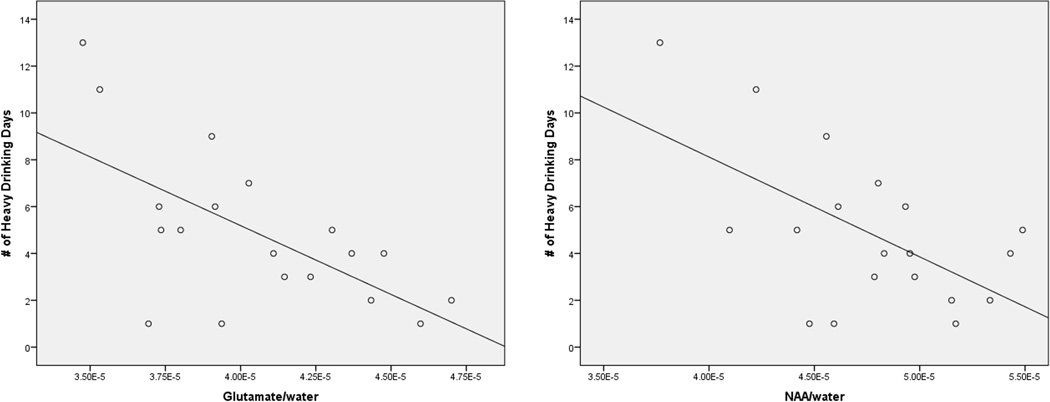
Scatterplots, with linear regression line added, for the associations between number of heavy drinking days and dACC Glutamate/water (left) and NAA/water (right).

Scatterplots, with linear regression line added, for the associations between number of heavy drinking days and dACC Glutamate/water (left) and NAA/water (right).