Figure 2.
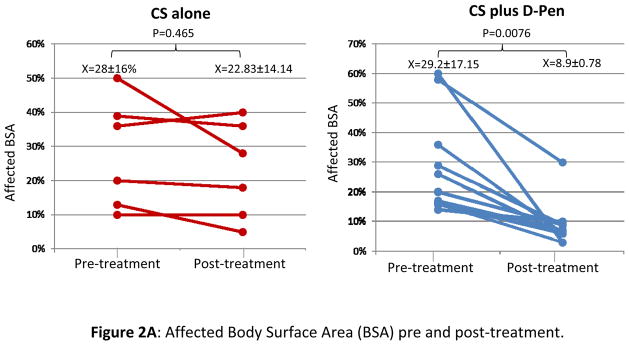
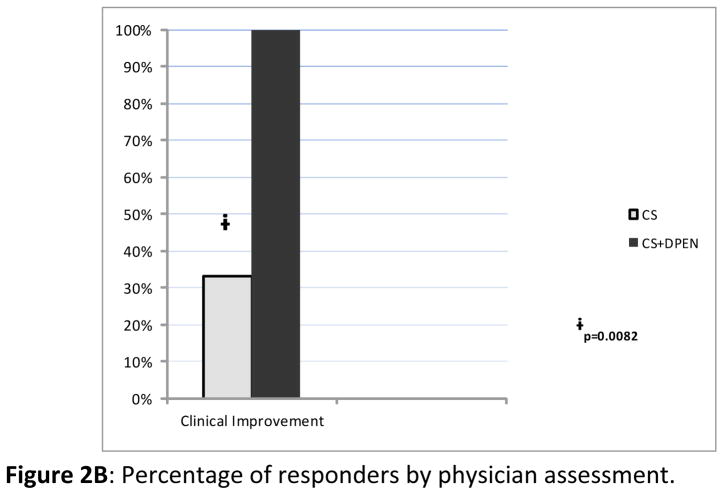
A: Affected body surface area (BSA) prior to initiation of treatment (pre-treatment) and at treatment termination (post-treatment) in patients treated with CS alone or with D-Pen plus CS. B: Bar graph showing the averages of clinical response of patients treated with CS alone or with D-Pen plus CS according to treating physician assessment.
Figure 2A. Affected Body Surface Area (BSA) pre and post-treatment.
Figure 2B. Percentage of responders by physician assessment.


