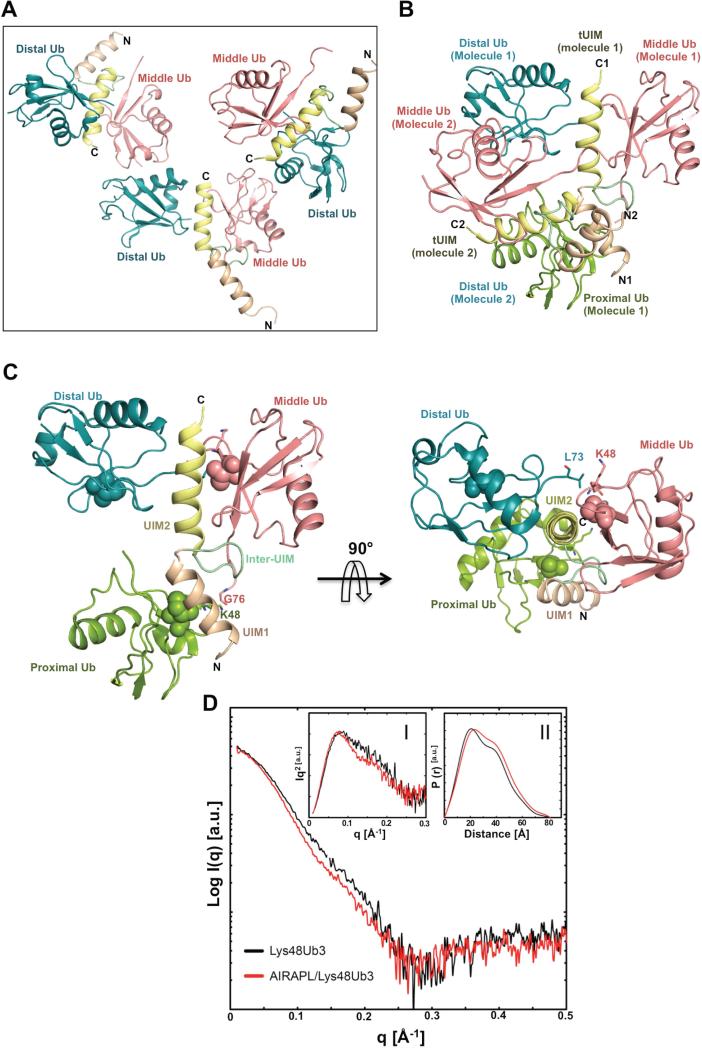
Figure 2. Structure of the AIRAPL tUIM in complex with a Lys48-linked tri-ubiquitin chain.
(A) There are three complex molecules in each asymmetric unit (AU) that each complex is composed of one tUIM and two ubiquitin moieties (distal and middle) (See also Fig. S3a-c). (B) Two complex molecules from neighboring asymmetric units (molecules 1 & 2) where distal ubiquitin of molecule 2 acts as the proximal ubiquitin for molecule 1. N1, C1 and N2, C2 indicate N- and C-term of tUIMs from molecules 1 and 2, respectively. (C) The overall structure of tUIM/ Lys48-linked tri-ubiquitin in two orthogonal views. UIM1 and UIM2 are shown in light orange and yellow, respectively. The inter-UIM loop is colored in peach. The distal, middle and proximal ubiquitins are shown in blue, pink and green. The spheres represent Ile44 from each ubiquitin moiety. The most C-terminal residues from distal and middle ubiquitins and Lys48 residue of middle and proximal ubiquitins are indicated as sticks. (D) SAXS intensity of Lys48-linked tri-ubiquitins alone (black) and in complex with AIRAPL tUIM (red). Kratky plots and P(r) functions of the data were shown in Inset I and II, respectively. Inset I: Tails of Kratky plots of both curves gradually converged to a baseline at higher q range, suggesting well-folded multi-domain conformations. Inset II: a significant peak shift was observed in P(r) function indicating that the complex has a more globular shape than Lys48-linked tri-ubiquitins alone (See also Fig. S3D).

