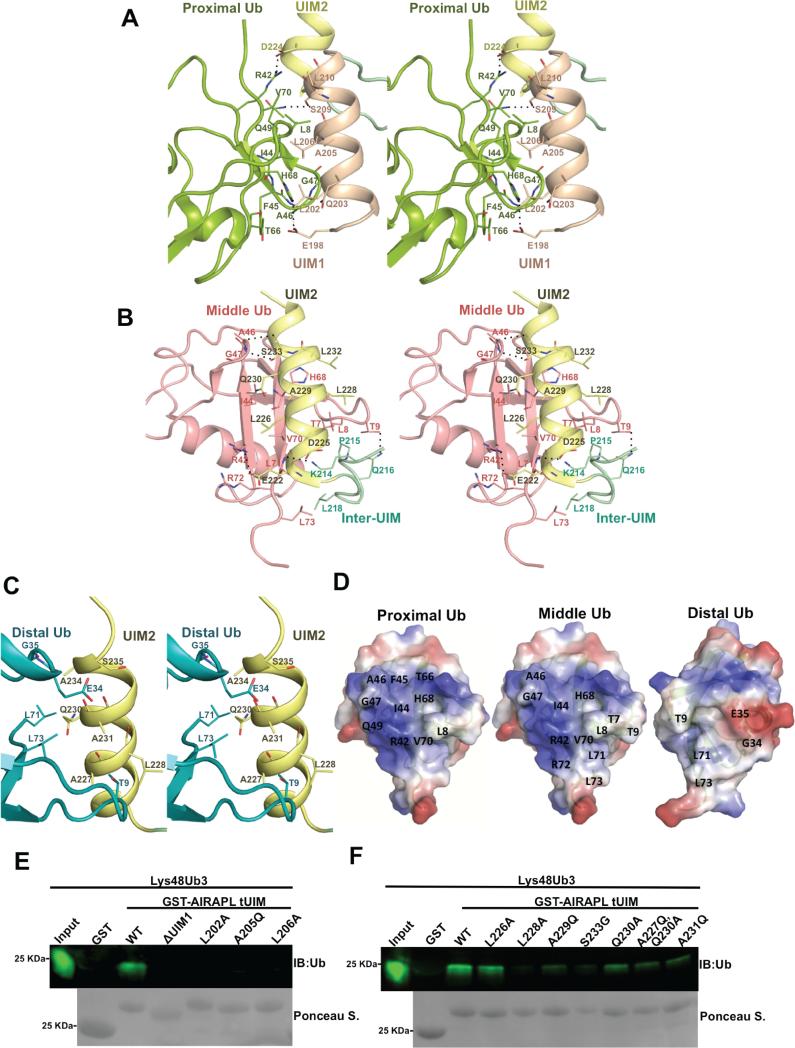
Figure 3. Characterization of the interactions between AIRAPL tUIM and ubiquitin moieties.
Stereo-views of the interactions between (A) UIM1 and proximal ubiquitin, (B) UIM2/inter-UIM and middle ubiquitin, (C) UIM2 and distal ubiquitin. The color codes are similar to Fig. 2b. Hydrogen bonds and salt bridges are indicated with dashed lines. (D) Surface representation of the interacting residues from the proximal, middle and distal ubiquitins. The surfaces are colored according to their electrostatic surface potential (blue, positive; red, negative). (E) Binding of the GST-tagged AIRAPL FL, tUIM WT and mutants to Lys48-linked tri-ubiquitin chains was analyzed by immunoblotting using anti-ubiquitin antibody. Loading of GST-tagged proteins was determined by Ponceau S staining (See also Fig. S4).

