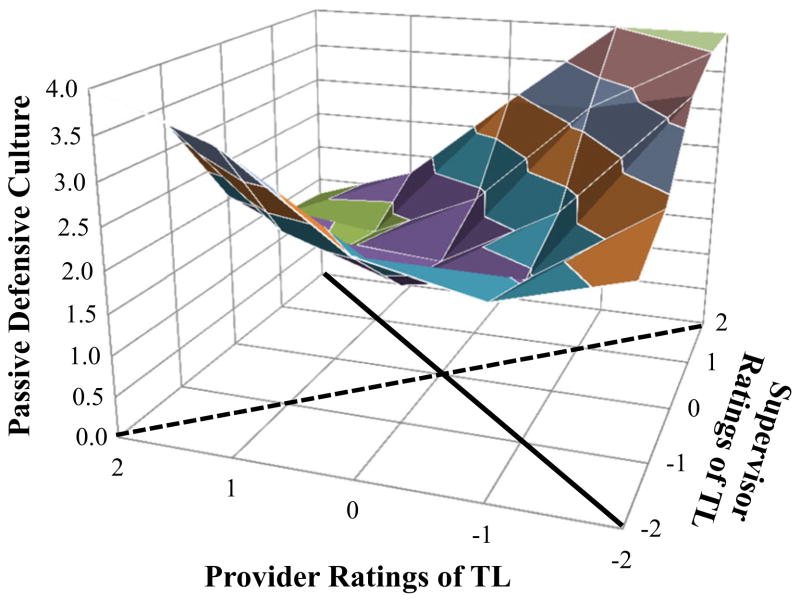
Fig. 4.
Defensive culture predicted from discrepancy between supervisor and provider ratings of Transformational Leadership (TL). a1: The line of perfect agreement (solid black line on floor) as related to overall Defensive Culture (PDC) has a negative slope. Thus, agreement between supervisors and provider’s TL ratings matters such that the greatest level of PDC is at the front corner of the graph where supervisor and provider TL are both low, and decreases toward the back of the graph where both supervisors and provider’s TL are both in agreement and high. a4: Moving along the line of incongruence (dashed line on floor) away from the center of the graph to either the left or right shows how the degree of discrepancy between supervisors and provider’s TL had a significant curvilinear relationship with PDC. The graph shows that toward the left and right of the graph, where ratings become more and more discrepant, PDC increases. a3: The direction of discrepancy matters. At the bottom right corner of the graph (where provider ratings of TL is low combined with high supervisor ratings of TL), PDC is very high. At the bottom left corner of the graph (where provider ratings of TL is high combined with low supervisor ratings of TL), PDC is high, though not as high as when supervisor rating of TL are high and provider ratings are low

