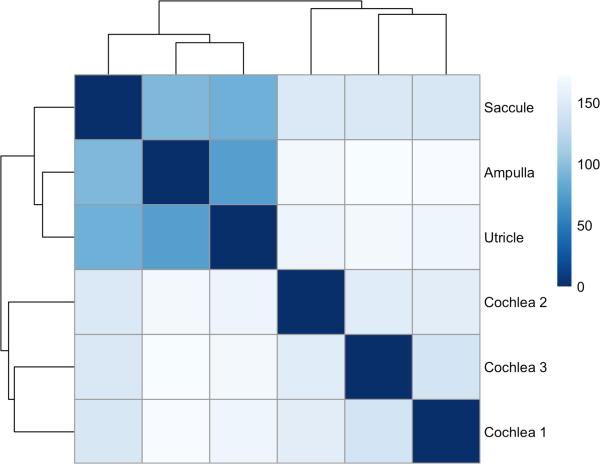
Figure 1.
Heatmap showing the Euclidean distances between the 6 human tissues studied by RNA-Seq including 3 cochlear and 3 vestibular samples (ampulla, saccule and utricle). Cochlear and vestibular tissue transcriptional environment can be clearly distinguished from each other. Regularized log transformation of counts generated in HTSeq were used to create this plot.

