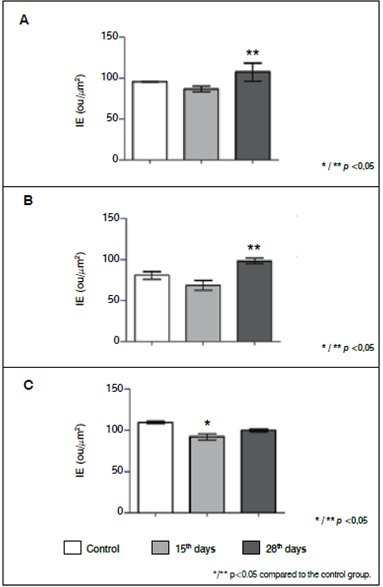
Figure 3. Digital quantification of collagen I, metalloprotease-2 (MMP2) and metalloprotease-9 (MMP9). (A) collagen I; (B) MMP2; (C) MMP0. The values represent the Index of Expression (IE) obtained as described in methods. The values represent media and standard deviation. The statistic analysis were performed using Kruskal-Wallis Test with Dunn's Multiple Comparison Test.