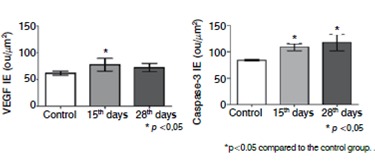
Figure 7. Digital quantification of VEGF e Caspase-3. The values represent the Index of Expression (IE) obtained as described in methods. The values represent media and standard deviation. The values represent media and standard deviation. The statistic analysis were performed using Kruskal-Wallis Test with Dunn's Multiple Comparison Test.

