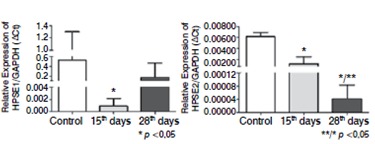
Figure 8. Heparanase-1 (HPSE1) and heparanase-2 (HPSE2) expression by quantitative RT-PCR. Quantitative RT-PCR analysis were performed as described in Methods, using cDNA samples obtained from intervertebral disc after degeneration induction (15 and 28 days), control (samples obtained from rats non submitted to the degenerative process).

