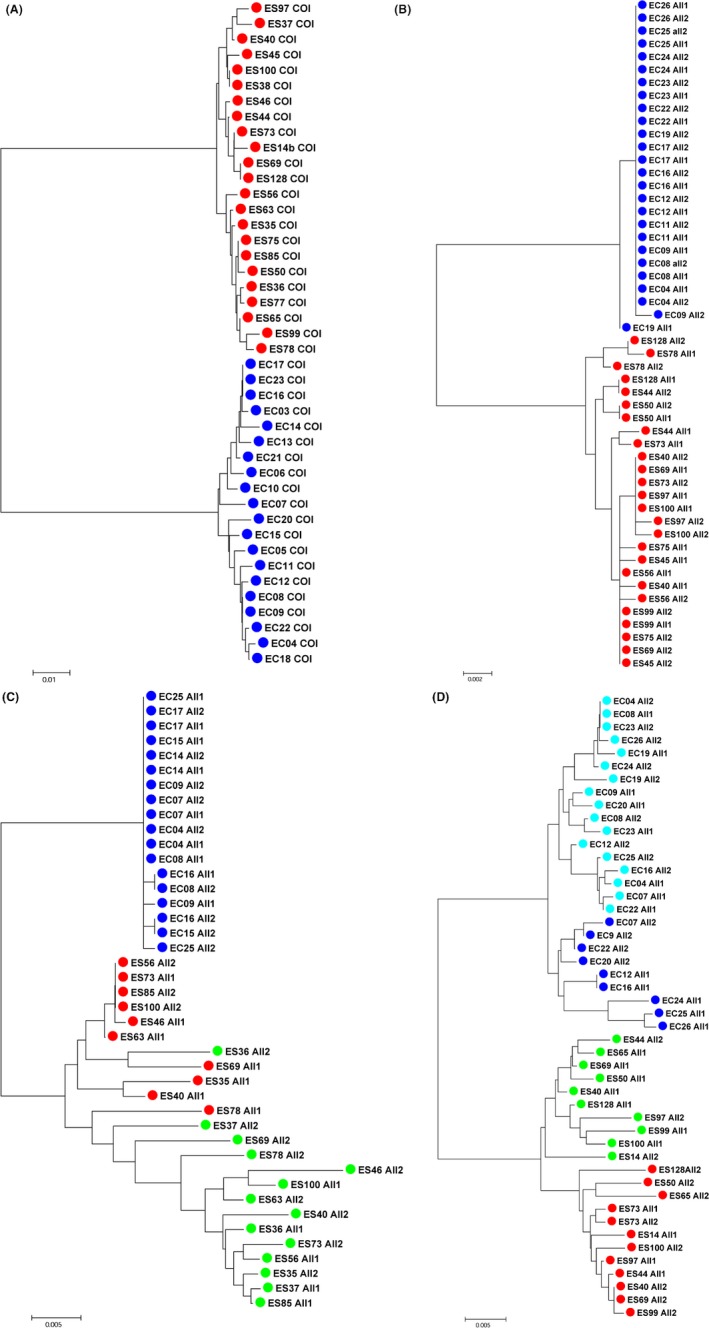
Figure 2.

Coalescence tree of (A) cox‐1, (B) hsp70 paralog A, (C) paralog B, (D) paralog C computed with the MEGA 5.0 software using the Minimum Evolution procedure (Kumar et al. 1994). Only the optimal trees for which the sum of branch length is minimal are shown. Trees are drawn to scale, with branch lengths in the same units as those of the evolutionary distances used to infer the phylogenetic tree. The evolutionary distances were computed using the p‐distance method and were in the units of the number of base differences per site. The ME tree was searched using the Close‐Neighbor‐Interchange (CNI) algorithm at a search level of 0. Each color materializes allelic lineages for both species: in paralog B, green color corresponds to the Gly insertion, and the red one to the Gly deletion, in paralog C, the dark (R) and light blue (I) colors correspond to the two R vs I allelic lineages in E. crystallorophias whereas the red (K) and green (M) colors represent the two K vs M allelic lineages in E. superba. The first two letters (EC or ES) in the sequence label represent the species name and are followed by the individual number and the allele number (All1 or All2).
