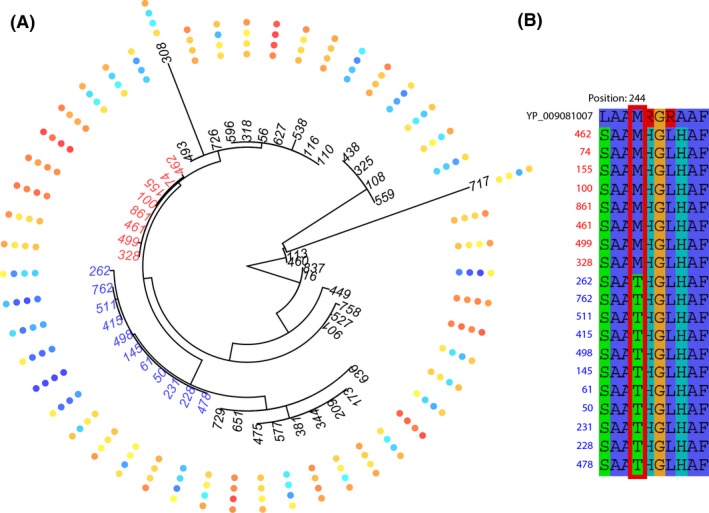
Figure 3.

Bullseye plot, nifD/Partner Quality – (A) Fan phylogeny of nifD with measure of partner quality mapped to the tips. Traits, from inside out: shoot mass, leaf number, stolon number, and chlorophyll content. Darker colors represent values that are further away from the mean, with blue indicating below the mean (−) and red indicating above the mean (+). Strains from two clades are highlighted: the clade in blue is predominantly below the mean, while the clade in red is predominantly above the mean. (B) Amino acid alignment of residues 241–250 of nifD, with a MoFe subunit interaction site (residue 244) outlined in red; the same strains are highlighted as above.
