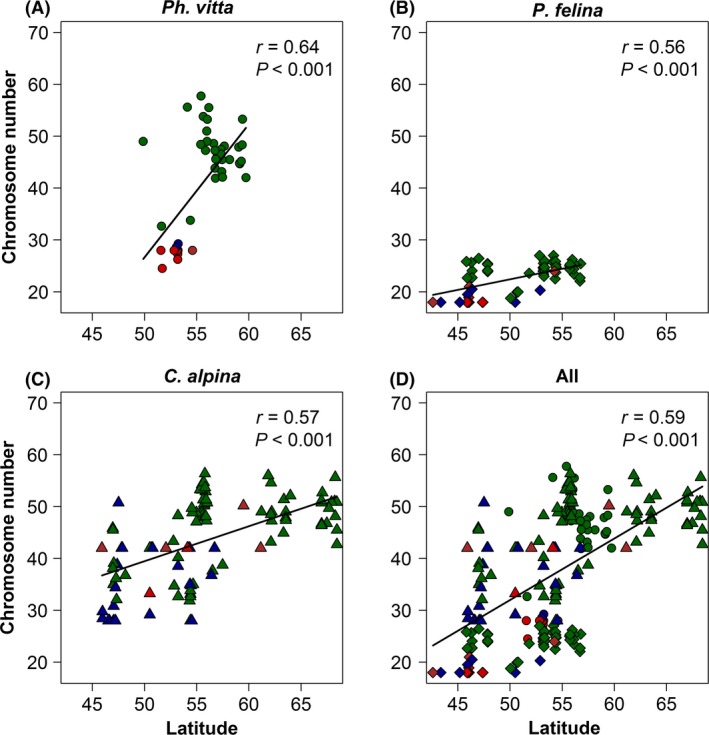
Figure 4.

Relationship between latitude and mean chromosome numbers of the populations of three freshwater flatworm species (Ph. vitta, P. felina and C. alpina). (D) represents the relationship across all populations of all three species. Correlation coefficients and P‐values are from simple linear regressions. The different colors represent the reproduction mode of the populations: green = asexual, red = sexual, blue = sexual and asexual, brown = unknown.
