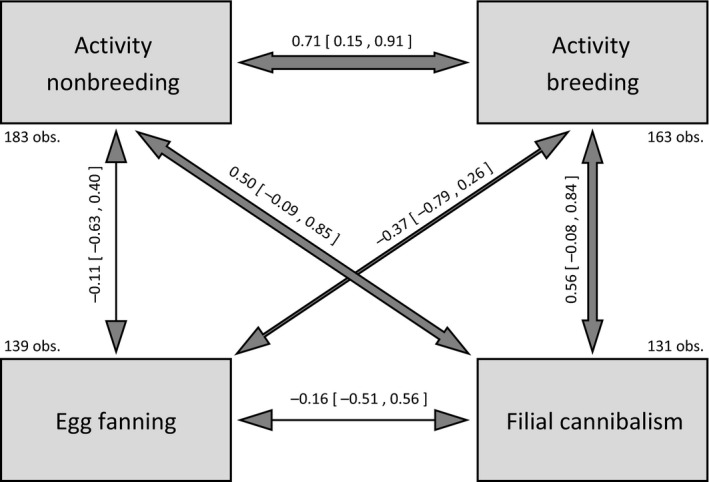
Figure 4.

Behavioral correlations represented by correlation coefficients and their corresponding 95% credible intervals as estimated by a multiple‐response MCMC model (n = 131–183 observations of 23 individuals; number of observations for each behavior given in figure). Credible intervals not crossing zero identify significant correlations. Arrow thickness indicates the strength of the correlation.
