Figure 6.

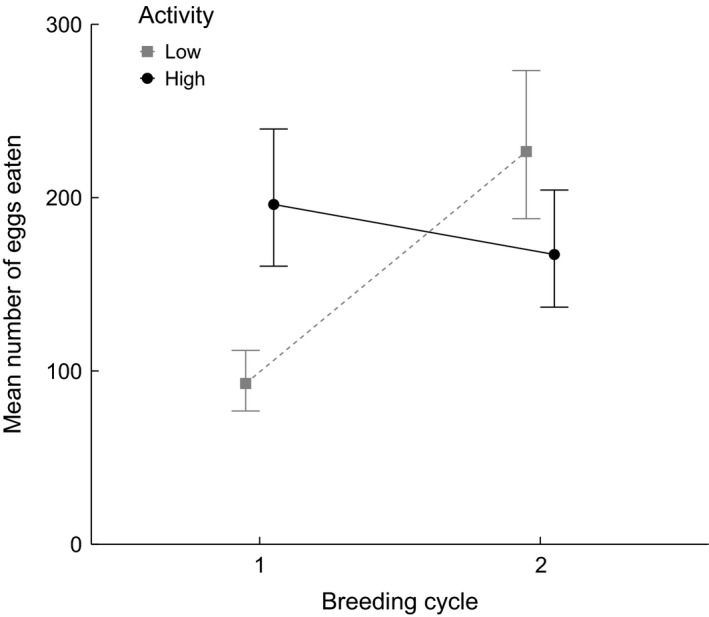
Interaction plot based on model estimates for the mean absolute number of eggs cannibalized per fish (excluding cases of TFC). Presented are group means and standard errors for each factor combination of activity and breeding cycle.

Interaction plot based on model estimates for the mean absolute number of eggs cannibalized per fish (excluding cases of TFC). Presented are group means and standard errors for each factor combination of activity and breeding cycle.