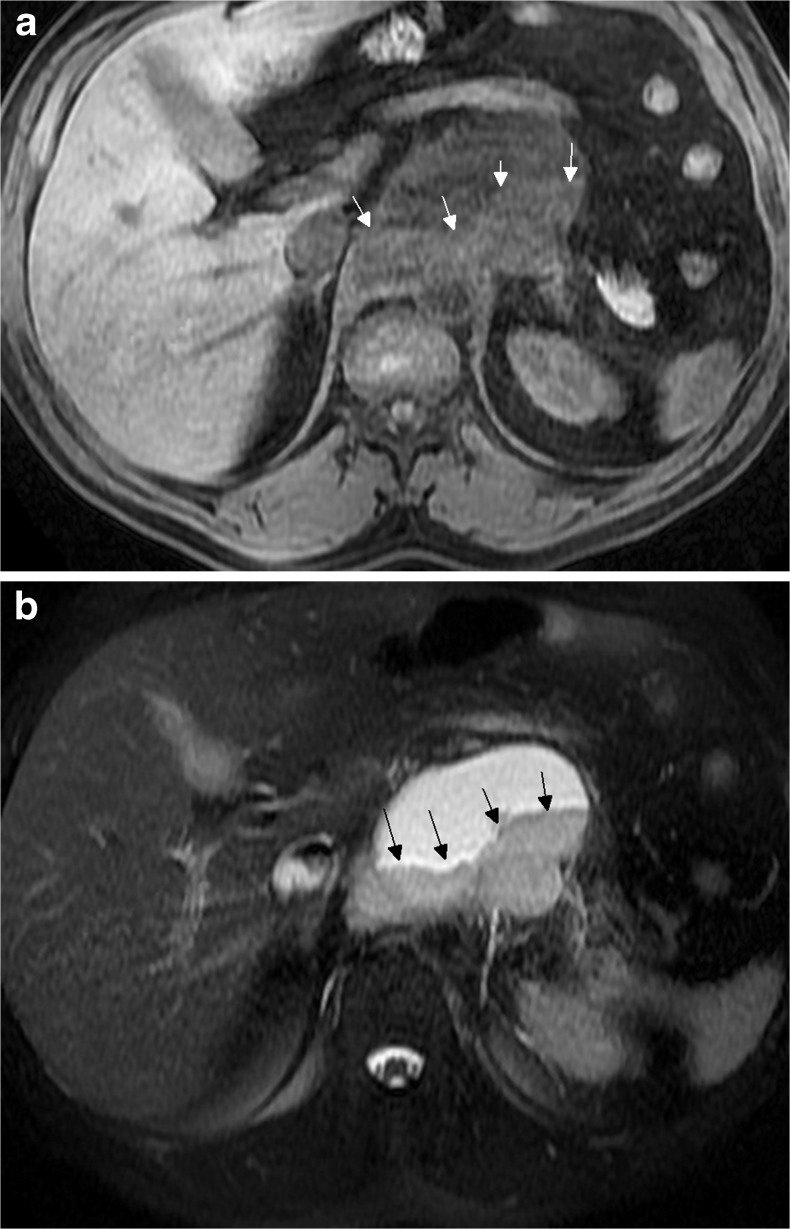
Fig. 1.
Axial fat suppression-spoiled gradient echo T1-weighted precontrast image (a) shows rather hyperintense component (white arrows) inside the cyst. Single-shot fast spin echo T2-weighted image with fat saturation (b) shows that it corresponds to a fluid-fluid level (black arrows) regarding methemoglobin, mucin, or protein content of the cyst

