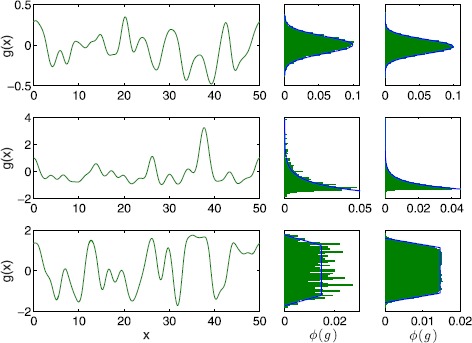
Fig. 1.

Random thresholds. Realisations of the random threshold (left) for a Gaussian (top), shifted exponential (middle) and bump (bottom) distribution. The middle column shows the probability distribution of the threshold on the left. The right column depicts the probability distribution of the threshold obtained from 1000 realisations. Equation (9) was truncated after 50 (top), 32 (middle) and 64 (bottom) terms per sum, respectively. Parameter values are , and (top), , (middle) and , , (bottom)
