Fig. 10.

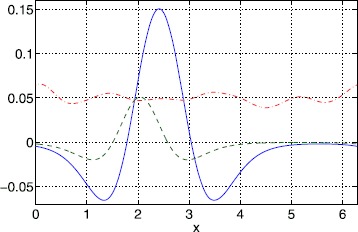
Bumps for a Gaussian threshold distribution. Stable (solid) and unstable (dashed) solutions corresponding to the two points in Fig. 9 with slightly less than 2. The threshold is shown dash-dotted. Parameter values are , , , , , and

Bumps for a Gaussian threshold distribution. Stable (solid) and unstable (dashed) solutions corresponding to the two points in Fig. 9 with slightly less than 2. The threshold is shown dash-dotted. Parameter values are , , , , , and