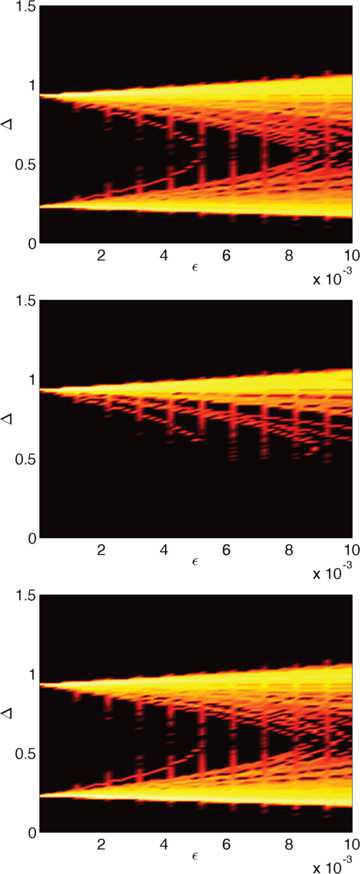
Fig. 17.

Probability distributions of bump widths for a non-Gaussian threshold distribution. Logarithm of the probability of the bump width Δ when the local probability distribution is given by a shifted exponential and the covariance function is Gaussian: all bumps (top), stable bumps (middle), unstable bumps (bottom). Parameter values are , , , , , and
