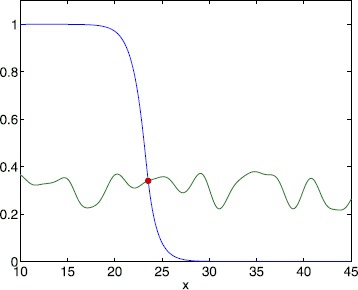
Fig. 2.

Travelling front. Instance of a travelling front (blue) for the bump distribution. The threshold is shown in green. The red dot indicates the position where . Equation (9) was truncated after 64 terms per sum. Parameter values are , , , , , and
