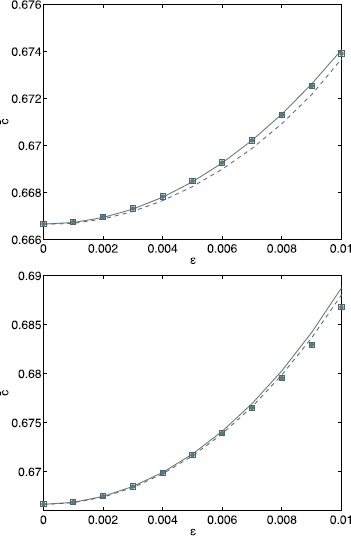
Fig. 6.

Mean speed versus ϵ for non-Gaussian threshold distributions. c̅ as a function of ϵ for , , for the exponential distribution (top) and the bump distribution (bottom). In each panel results for the non-Gaussian distribution (dashed blue) are compared to those for a Gaussian distribution (solid green) with the same variance. Solid/dashed curves: (24); blue squares (non-Gaussian)/green circles (Gaussian): from averaging (21) over 1000 realisations per point. Equation (9) was truncated after 250 terms per sum. Other parameter values are , (top) and , , (bottom)
