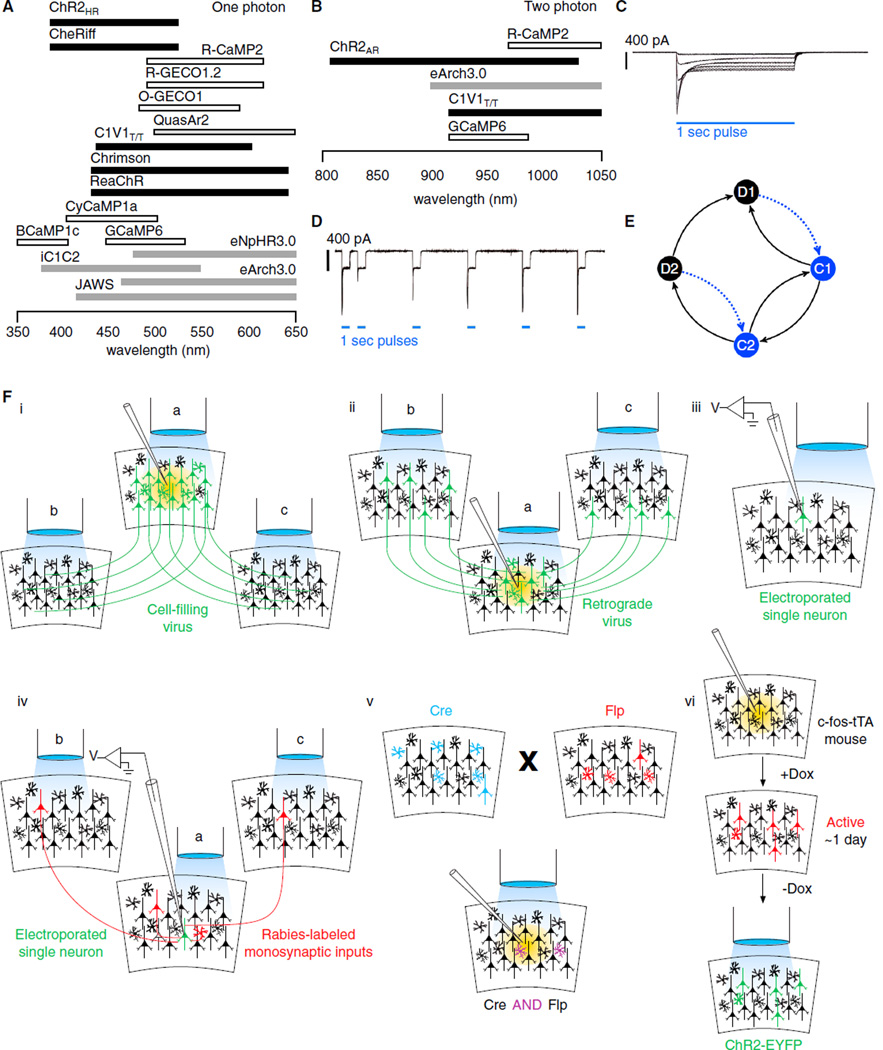
Figure 3. Consideration of Sensor, Actuator, and Targeting Parameters for Closed-Loop Optogenetics.
(A) Bars showing action spectral ranges of potentially compatible opsins and sensors (thresholded at 20% of peak; note that this is just a cross-section of representative proteins—there are many more in the literature) for one-photon closed-loop optogenetic control. Ranges for each protein are shown as horizontal bars, with color indicating excitatory actuators (black), inhibitory actuators (gray), calcium sensors (white) or voltage sensors (gray with black border; adapted from Mattis et al., 2012; Hochbaum et al., 2014; Inoue et al., 2015; Wu et al., 2013; Yizhar et al., 2011b; Klapoetke et al., 2014; Lin et al., 2013; Akerboom et al., 2012, 2013; Chen et al., 2013c; Berndt et al., 2014; Gradinaru et al., 2010; Chuong et al., 2014). Note that this is high-level comparison and that it is critical to examine nonnormalized spectra and other published details for each protein (for a developing resource in this area, see http://actionspectra.org).
(B) Bars like those in (A), but showing thresholded action spectra ranges for proteins compatible with two-photon closed-loop optogenetic control (adapted from Inoue et al., 2015; Prakash et al., 2012; Chen et al., 2013c; Akerboom et al., 2012).
(C and D) (C) Peak-to-steady-state ratio of a typical channelrhodopsin changes with stimulation light intensity (D) and with history of stimulation over time (J. Mattis and K.D., unpublished data); scale bars, 400 pA; light pulses, 1 s.
(E) These nonstationary effects can be efficiently modeled using simple linear dynamical systems (Nikolic et al., 2009; Nagel et al., 2003; Hegemann et al., 2005), e.g., describing the photocycle dynamics in terms of two conducting states that conduct at different rates (C1 and C2) and two dark states that are differentially excited to the high (C1) or low (C2) conducting states when photoexcited (D1 and D2, respectively; see equations 1a-1d of Hegemann et al., 2005). Here arrows denote transitions states governed by rate constants, and blued dotted lines show excitation from dark to conducting states by photostimulation.
(F) Targeting strategies for mammalian gene expression in specific neurons, cell types, and circuits. (i) Gene expression can be restricted to a particular brain area by localized viral injection; the virus is engineered to introduce a specific gene(s) of interest (e.g., an opsin or GECI), and may be biased to specific cell types by combinations of promoter used and viral tropism (Nathanson et al., 2009). Optogenetic light stimulation at the site of the injection (fiber a) will potentially perturb multiple outputs from the source brain area. Stimulating opsins located in projections (optical fibers b and c) from the source area can distinctly perturb specific pathways from the source brain area. (ii) Retrograde tracing viruses can infect local axon terminals and label inputs to a given brain area. Optogenetic light stimulation can be restricted to the site of injection (optical fiber a), or specific inputs (optical fibers b and c). (iii) Gene expression specificity can be restricted even to a single neuron in vivo by single-cell transfection, e.g., by single-cell electroporation (Kitamura et al., 2008). (iv) Transsynaptic tracing rabies virus can restrict expression to monosynaptic inputs to a specific population of neurons (Wickersham et al., 2007b), cell type labeled with Cre (and targeted by expression from a Cre-dependent helper virus; Wall et al., 2010), or to a single neuron by single cell transfection methods (e.g., electroporation, Marshel et al., 2010; whole-cell configuration, Rancz et al., 2011). Light-restriction strategies are similar to as in (ii) in terms of addressing specific inputs (optical fibers b and c), with the additional advantage that the transfected neuron (or Cre-defined population) at the site of the optical fiber a can be targeted for specific gene expression, separate from and in addition to the gene(s) expressed by the rabies virus. (v) A multitude of transgenic mouse lines exist for targeting specific cell types with recombinases to restrict gene expression in recombinase dependent fashion (for example, see Taniguchi et al., 2011). Intersectional strategies can increase specificity through “Boolean logic” operations of combinations of Cre and/or Flp recombinase expression (including AND, NOT, OR, NAND, NOR, XNOR, and XOR) (Fenno et al., 2014). (vi) Targeting gene expression to neurons activated in a specific time window (hours to ~1 day) is possible by taking advantage of immediate early gene expression and inducible genetic targeting systems (Liu etal., 2012). Importantly, for all of these examples, closed-loop control strategies can be implemented using all-optical methods (e.g., imaging and stimulating through the same fiber), as further elaborated in Figure 4. See Huang (2014); Luo et al. (2008), and Packer et al. (2013) for recent reviews including additional gene-targeting strategies.

