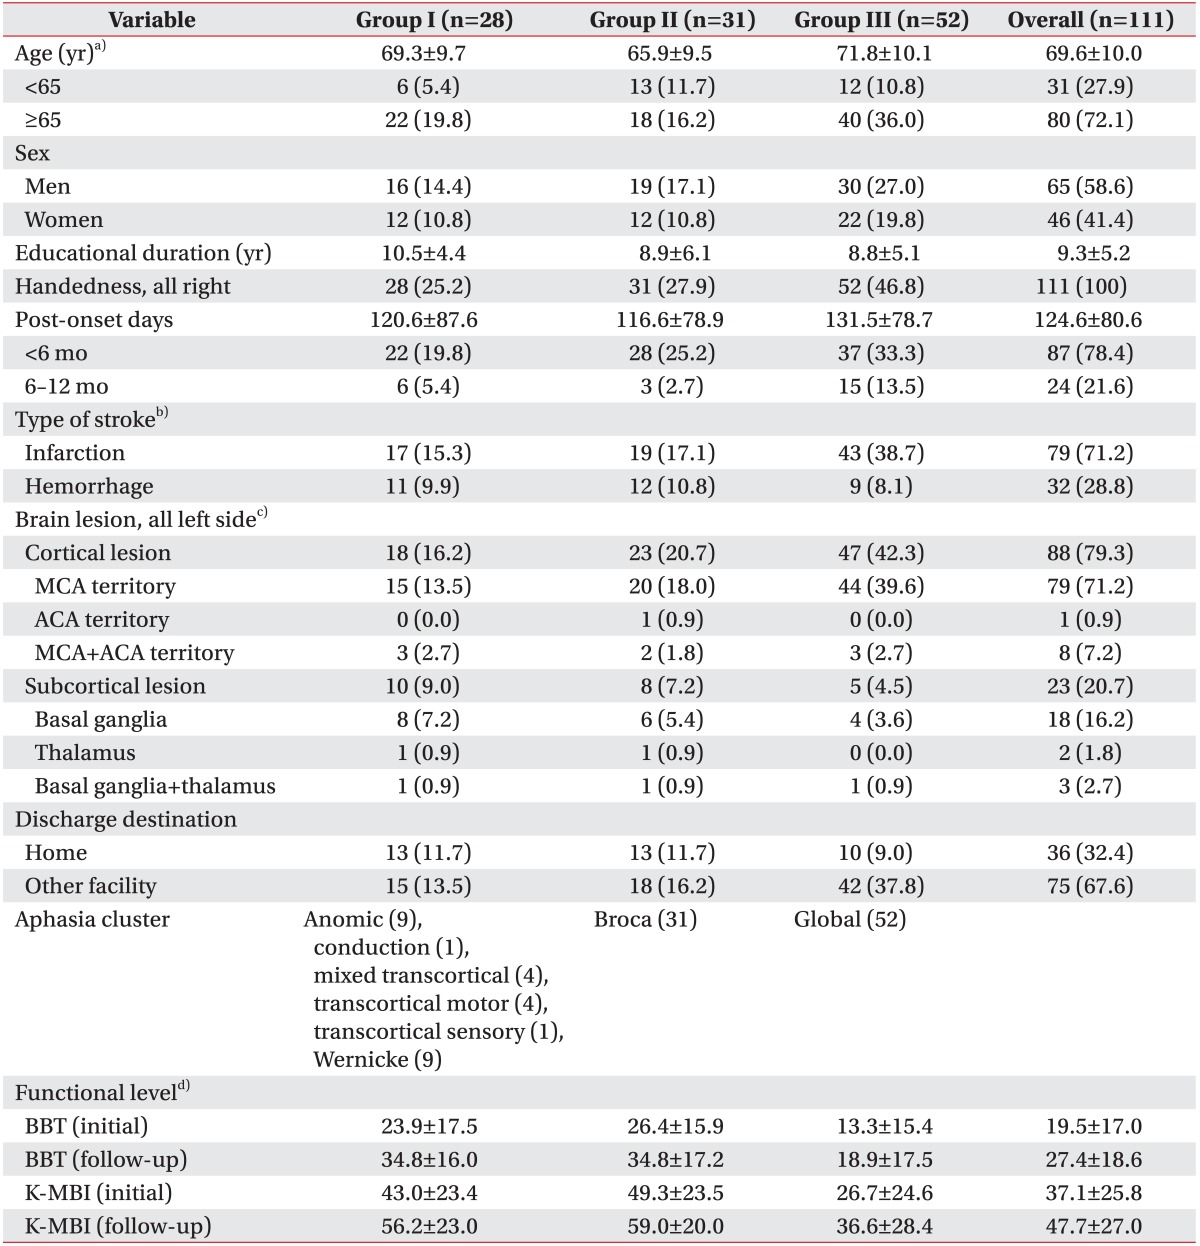
Table 1. Baseline characteristics according to the aphasia cluster.
Values are presented as mean±standard deviation or number (%)
n, sample size; MCA, middle cerebral artery; ACA, anterior cerebral artery; BBT, Berg Balance Test; K-MBI, Korean version of Modified Barthel Index.
a)p=0.02 between group II and III by one-way ANOVA followed by Tukey post-hoc test. Educational duration and post-onset days were not significantly different among the groups.
b)p=0.04 by chi-square analysis (χ2=6.3). Categorical age (<65 vs. ≥65 years) and post-onset duration (<6 mo vs. 6–12 mo) and sex did not show statistical significances.
c)p=0.02 by chi-square analysis (χ2=8.2) between aphasia clusters and brain lesions (cortical vs. subcortical lesion).
d)Group III showed significantly low functional level, as compared to group I or II by one-way ANOVA followed by Tukey post-hoc test (p<0.05, p<0.01 or p<0.001).

