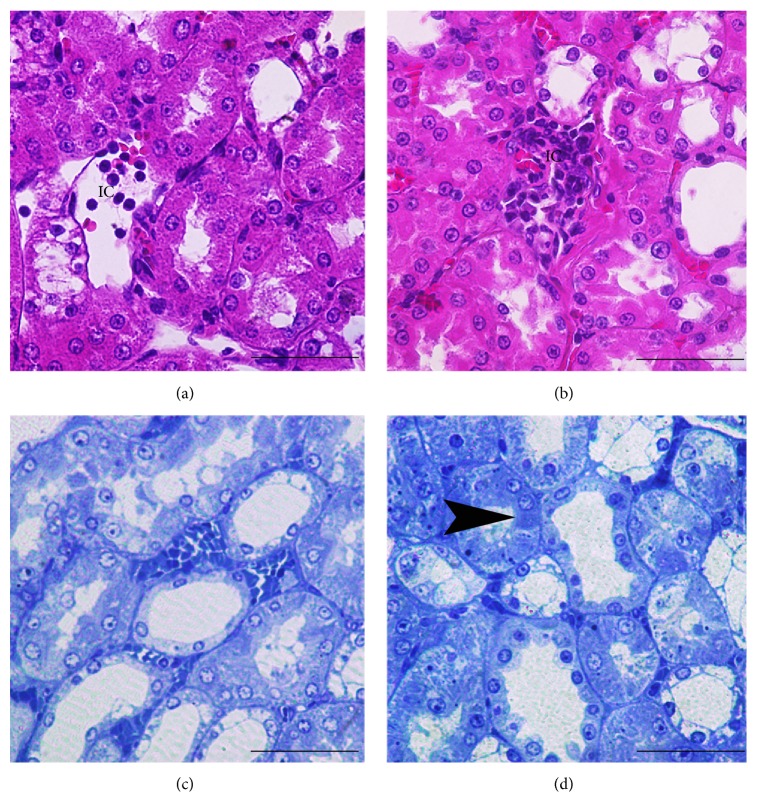
Figure 4.
Morphology of renal tubular cells of MTDRs ((a), (c)) and MTCIN + DRs ((b), (d)). MTDRs showed similar patterns to HRs; however, inflammatory cell infiltration and vacuolization are demonstrated in MTDRs (arrow head). Histological section of the renal tissues contrast dye application after melatonin treatment (Figures 4(b) and 4(d)) showed mild interstitial leukocytes infiltration (Figure 4(b)) and Armanni-Ebstein lesions in tubule cells (arrow head) (Figure 4(d)). ((a) and (b)) Histological micrographs were stained with H&E and had scale bars with 150-micron size. Histological micrographs were stained with toluidine blue and had scale bars with 150-micron size (Figures 4(c) and 4(d)). MTDRs: melatonin-treated diabetic rats; MTCIN + DRs: melatonin-treated diabetic rats with contrast-induced nephropathy; HRs: healthy rats; CIN + DRs: diabetic rats with contrast-induced nephropathy.

