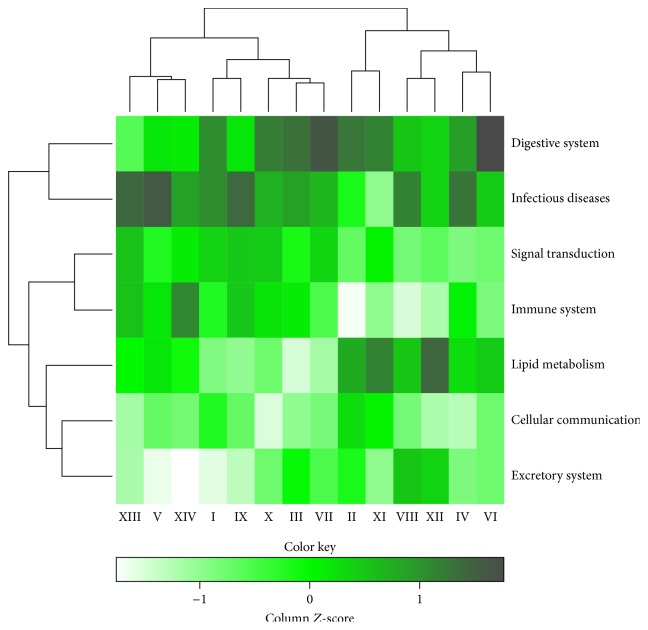
Figure 4.
The heatmap compares the seven major pathway motifs that were annotated based on the number of enriched pathways in each cluster, which were normalized. The more saturated colour across clusters represents the more significant pathway motif. The significant cluster for a particular pathway can be suggested to be further explored for a disease with the known pathway motif such as digestive system in liver disease.

