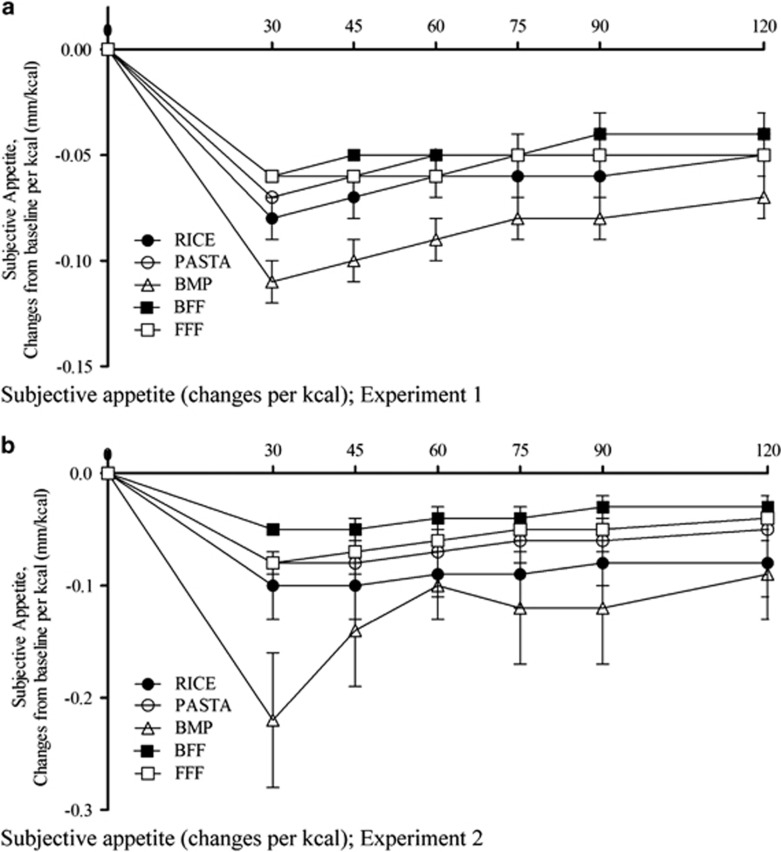
Figure 1.
Effect of treatments on average subjective appetite (changes from baseline per kcal) over time. (a) Experiment 1, (b) experiment-2. Values are means with their standard errors represented by vertical bars (n=20: experiment 1, n=12: experiment 2). All measures changed over time (P<0.0001), and subjective appetite was affected by treatment in both experiments 1 and 2 (P<0.05, by two-way ANOVA; BMP resulted in lower subjective appetite (changes from baseline per kcal compared to all other treatments) in experiment 1 (P<0.001) and experiment 2 (P<0.001)).

