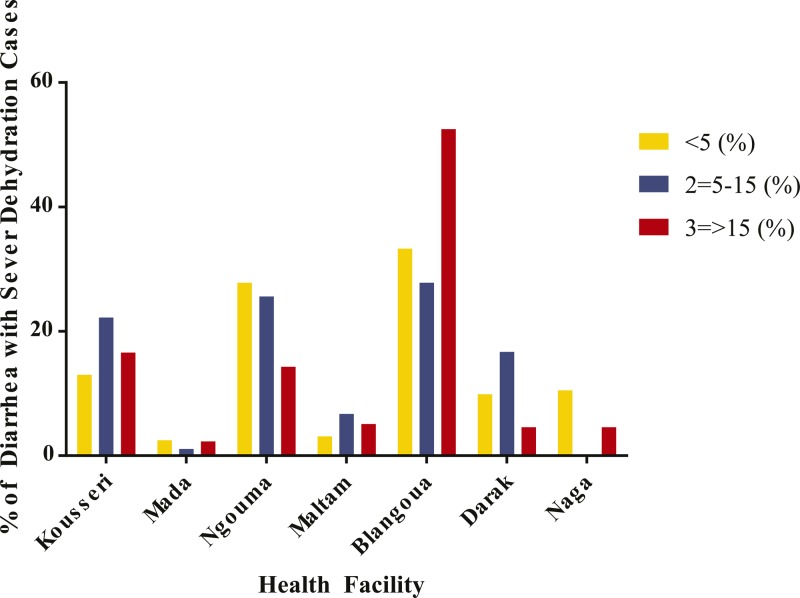
Figure 4.
Percentage of diarrhea cases with severe dehydration stratified by age group across health facilities. The graph demonstrates the percentage of severe diarrheal cases enrolled at each health facility participating in the surveillance efforts. Blangoua had the highest numbers among all age groups.

