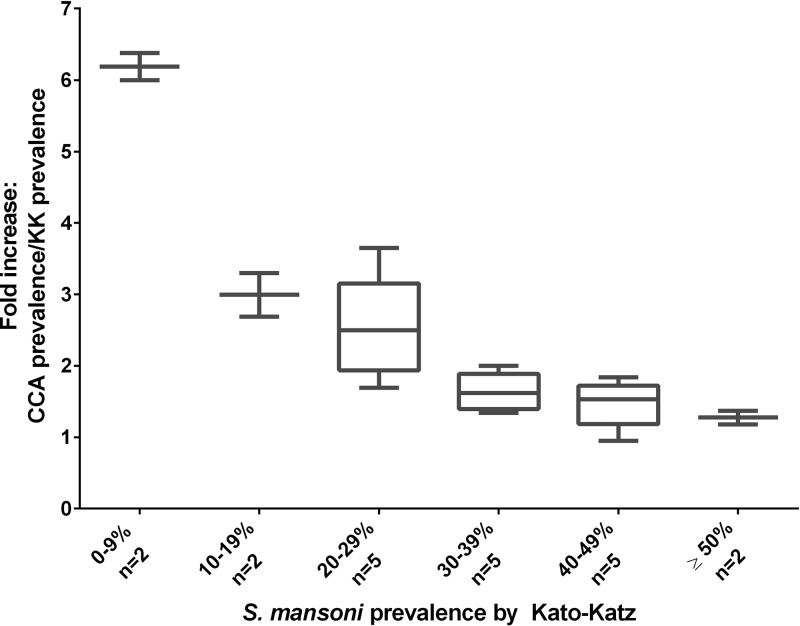
Figure 3.
Box plots indicating the median, quartiles, and range of the effective multiplicative increases observed in prevalence when comparing single urine point-of-care circulating cathodic antigen (CCA) and single-stool Kato-Katz (KK) prevalence values for the same study populations (y axis), when classified according to ascending categories of observed KK prevalence (x axis).

